





Another tip: If you integrate cameras on your buses, have a behavioral specialist monitor the route live to spot missed triggers for riders with behavioral concerns.
School Transportation Data Is Only as Powerful as the Story It Tells
Leaders say turning operational metrics into student-centered narratives can help districts justify investments and improve service.
July 21, 2026
Transportation leaders must understand how to connect operational metrics to student outcomes, safety improvements, financial stewardship, and service quality.
Credit:
Teena Mitchell/School Bus Fleet
8 min to read
- Leaders emphasize the importance of transforming operational metrics into compelling student-centered narratives.
- Districts can use these narratives to effectively justify investments in school transportation.
- Improved storytelling in transportation data can lead to enhanced service and decision-making within schools.
*Summarized by AI
Transportation directors rarely struggle to find data. The bigger challenge is getting someone else to care about it.
Most school transportation departments can quickly generate reports showing late routes, overloaded buses, inefficient run pairings, driver shortages, or rising ride times. Modern routing software, GPS systems, geofencing tools, and onboard technology have made it easier than ever to measure operational performance.
Yet when transportation leaders bring those numbers to a superintendent, school board, or budget committee, the conversation often stalls. Operational metrics may explain what is happening, but they don't always explain why it matters.
That's the challenge Teena Mitchell, special needs transportation coordinator for Greenville County Schools in South Carolina, addressed during a presentation at the 2025 STAI conference. While her session explored the role of routing software, GPS technology, and route optimization, Mitchell's message had more to do with communication. Transportation leaders, she argued, need to learn how to turn data into influential stories.
"Data alone may not always be compelling, but when it is connected to operational needs and student outcomes, it becomes much more meaningful," Mitchell explained.
The school transportation departments that successfully secure support for changes often aren't the ones with the most sophisticated software. They're the ones who can clearly explain how transportation decisions affect students, schools, and communities.
"I was told one time, thinking and feeling might not be the way to sell an idea," David Poag, director of transportation at Spartanburg School District #6, added during a 2025 ACTS panel where he discussed how geofencing and GPS can help adjust bell times. "You may need data to sell that idea, and numbers. What do the numbers say?"
Looking Beyond the Dashboard
Mitchell works in a district where data is abundant. Greenville County Schools serves approximately 78,000 students across 106 schools and learning centers spread over 800 square miles. More than 500 buses operate throughout the district, transporting students across a service area that presents all the challenges common to large transportation operations, like:
- Traffic congestion
- Changing enrollment patterns
- Staffing concerns
- Growing demands for efficiency
Like many districts, Greenville County routinely analyzes route performance data. Transportation leaders can monitor arrival and loading times, evaluate route efficiency, and identify trends that may indicate service issues. But Mitchell, like Poag, who also previously served as routing coordinator for Greenville County Schools, believes data becomes most valuable when transportation professionals move beyond the numbers themselves and ask, “What is the data actually telling us?”
That question is especially important when presenting information to district leadership. Transportation professionals often think in terms of routes, runs, stops, and fleet utilization. Superintendents and school boards tend to think in terms of student achievement, attendance, equity, and budget impact. If transportation leaders want support for a proposed change, they need to bridge that gap.
For example, a transportation department may discover that a particular group of routes is consistently arriving late to school. The operational data might indicate that buses are arriving 10 or 15 minutes after the desired time. While that information is useful internally, it may not resonate with decision-makers who are removed from day-to-day transportation operations.
The more compelling story is what those late arrivals mean for students.
Turning Transportation Data Into Student Outcomes
Before transportation leaders can tell a story with data, they first have to define the problem accurately.
"Do we have baseline data to define the problem?" Poag asked. "One of the most important things after you do a project is proving that you have succeeded with that project and continued to succeed."
One of the examples Mitchell and Poag shared involved late arrivals at secondary schools. Through GPS and routing data analysis, Greenville County identified a recurring issue: a significant number of students were arriving late to school due to transportation-related shortfalls.
The numbers were substantial. Between 1,800 and 2,300 middle and high school students missed instructional time each day due to late buses. On its own, that statistic highlighted an operational problem, but it didn't fully capture the impact. Mitchell encouraged attendees to look deeper.
A student who arrives 10 to 15 minutes late every day may not seem like a major concern when viewed as an isolated incident. Over the course of a school year, however, those missed minutes accumulate. Students can lose the equivalent of an entire class period every week. In some cases, the lost instructional time can add up to nearly seven weeks of first-period learning over the course of a year. With that example in play, suddenly, the conversation changes.
The issue is no longer about route performance percentages but now involves student achievement. Teachers lose instructional time. Students miss important classroom activities. Administrators face attendance and tardiness challenges that stem from transportation issues rather than student behavior.
When transportation leaders frame the problem this way, district leaders can more easily understand the significance of the issue. The data tells a story that extends beyond transportation operations and into the district's overarching educational mission.
What’s important to remember is that this approach can be applied to almost any transportation challenge.
If a district is considering GPS technology, the conversation shouldn't focus solely on tracking vehicles. Instead, transportation leaders can explain how real-time location information improves accountability, enhances communication with parents, and provides critical information during emergencies. If the goal is to implement geofencing, the story may center on improving accuracy, reducing disputes over arrival times, and creating better visibility into operational performance.
The technology itself is rarely the story. The impact of the technology is.
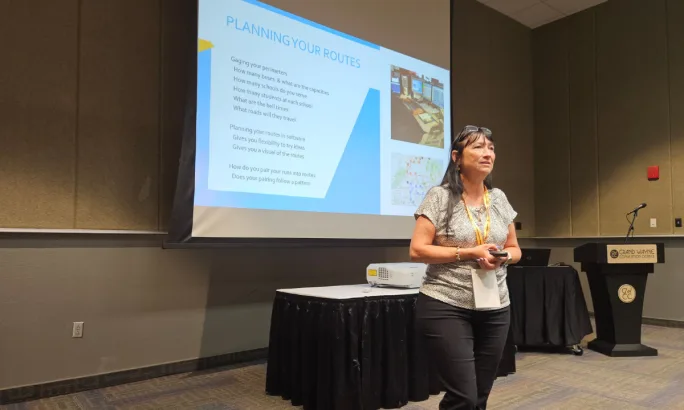
Teena Mitchell, special needs transportation coordinator for Greenville County Schools, presents during the 2025 STAI conference on using transportation data to drive better decision-making and improve student outcomes.
Credit:
Amanda Huggett
Using Technology to Build Evidence
Although Mitchell emphasized storytelling, she was equally clear that effective stories must be supported by reliable evidence. Transportation departments today have access to an impressive collection of tools to help identify problems and evaluate solutions:
- Routing software allows teams to model different scenarios, analyze capacities, adjust bell schedules, and identify inefficiencies.
- GPS systems provide real-time monitoring and historical performance data. Geofencing establishes objective arrival and departure times.
- Cameras can provide visibility into student behavior and operational challenges.
Mitchell's presentation was intentionally vendor-neutral because the principles apply regardless of which platform a district uses. Most modern routing systems offer similar capabilities, and it’s important to have a fruitful vendor partnership that works for your district. The difference lies in how transportation teams use the information that those systems generate.
The goal is to use data to answer questions:
- Why are routes running late?
- Which schools are most affected?
- How do bell schedules influence performance?
- What operational changes could improve outcomes?
The answers to those questions become the foundation for meaningful decision-making.
In Greenville County, transportation leaders used data to identify patterns and evaluate possible solutions. Rather than relying on assumptions, they examined route information, GPS records, loading times, and school schedules to understand the factors contributing to late arrivals.
The analysis, according to Greenville County Schools’ Director of Transportation, Adam James, ultimately led the district to explore a pilot program designed to create additional time for secondary routes.
Testing the Story Before Scaling It
One of Mitchell's recommendations for transportation departments is to pilot new ideas whenever possible.
Whether a district is considering new parent communication tools, changes to route structures, or operational adjustments, small-scale pilots can provide valuable insights while limiting risk. Greenville County followed that approach when exploring ways to improve secondary-school arrival times.
The district, according to James, launched a two-year pilot program that shifted elementary-school drop-off times from 7:15 a.m. to 7 a.m. at select schools. The goal was straightforward: create a larger operating window for secondary routes and reduce the number of students arriving late to middle and high schools.
Rather than implementing the change districtwide, James collected data and measured results at pilot locations.
Routes connecting Grove Elementary to Southside High improved on-time performance from 53% to 95%. Routes serving Wade Hampton High improved from 30% to 80.8%. Eastside High routes improved from 15% to 84.8%, while Greenville Middle School routes improved from 42% to 97.1%.
Just as important, the district projected that regular late arrivals among secondary students could drop from 16% to 2% if the approach was expanded.
Those results transformed the discussion. Transportation leaders were no longer presenting a theory about what might happen, but presenting evidence about what had already happened.
That's a much easier story to tell.
Technology Still Needs Human Judgment
Despite the benefits of routing software and GPS tools, Mitchell cautioned against relying exclusively on technology. Some of the most important routing decisions still require human judgment.
A route that appears efficient on a digital map may contain safety concerns that are difficult to identify through software alone. Tight turns, visibility issues, unusual traffic patterns, and roadway limitations may not be immediately obvious when viewing a route on a computer screen.
That's why Mitchell encourages transportation professionals to supplement routing technology with real-world observation. Street-view tools can help identify potential issues, but there is no substitute for understanding what drivers actually experience on the road.
"Don't set your driver up for failure because you created an unsafe route or stop," Mitchell said.
For example, setting up a corner stop. Drivers and directors cannot control traffic at that corner, which puts students on the ground in an unpredictably risky situation. Mitchell said it’s important to set stops at least 100 feet from a corner.
She also emphasized the importance of training. Technology investments only deliver value when employees understand how to use them. Transportation teams should ensure that routers, dispatchers, supervisors, and other staff members receive adequate training and regularly revisit routes as student populations and service needs evolve.
"You don't have time not to do proper routing," Mitchell said.
The Story Behind Every Number
For transportation professionals, it can be tempting to assume that data speaks for itself.
Mitchell reminds us that it rarely does. Data identifies problems. Data measures performance. Data helps evaluate solutions. But data alone doesn't always inspire action.
Stories do.
Transportation leaders must understand how to connect operational metrics to student outcomes, safety improvements, financial stewardship, and service quality. They know their audience and tailor their message accordingly. They use technology to gather evidence, but they focus on explaining why that evidence matters.
When a transportation department can demonstrate that a route change will preserve instructional time, improve equity, reduce parent concerns, or enhance student safety, the conversation becomes much more persuasive. So, use that data to tell a story worth acting on.
Subscribe to Our Newsletter
More Management

EverDriven Launches Route Consolidation Calculator to Estimate Diesel Savings
As diesel prices hit record highs, the largest alternative transportation provider says a 10% route consolidation could save a 120-route district more than $78,000 a year in fuel alone.
Read More →
Zum Secures Continued Financing Support for School Bus Expansion
Generate Private Credit has financed approximately $75 million in school bus deployments across three states, supporting more than 500 buses as Zum expands across the county.
Read More →
Beyond Discipline: A Different Approach to Student Behavior on the Bus
After implementing a dean of students program in Oregon, North Clackamas is seeing positive improvements. Here’s how it worked. The Route is brought to you by IC Bus.
Read More →
A Dean of Transportation's Different Approach to Student Behavior on the School Bus
After implementing a dean of students program in Oregon, North Clackamas is seeing positive improvements on the bus. Here’s how it worked.
Read More →
Inside NAPT ACTS 2026: Highlights from Louisville
From federal updates and student behavior strategies to new school bus technology and industry awards, see highlights from NAPT ACTS 2026 in Louisville.
Read More →
Meet the 2025 School Bus Driver Hero Winner: Annette Brown
We caught up with Wa-Nee Community Schools' Annette Brown on site at SBFX, where she was named the 2026 School Bus Driver Hero Award winner. Hear about her reaction, what she loves most about being a school bus driver, and more!
Read More →
Predictability Is Like Ketchup (According to 6-Year-Olds)
To students, a different school bus can feel like a full-blown crisis. One driver reflects on why familiar routines, showing up on time, and being reliably boring matter more than we think.
Read More →
Samsara Launches Free Driver Rewards Program
The new Driver Perks program gives eligible professional drivers access to discounts and offers without adding a cost for participating fleets.
Read More →
How Tax-Exempt Municipal Leases Can Help Finance School Buses
Let’s explore school bus financing options, including municipal leases, vendor payable accounts, and balloon payments, and how they can help stretch fleet budgets.
Read More →
Nominate Rising School Transportation Pros Under 40!
We’re searching for the next generation of leaders making an impact across the K-12 student transportation industry to recognize as SBF’s 2027 Trailblazers. Nominations are open now!
Read More →