




Traffic Control & School Bus Stops: 9 Keys to Keeping Students Safe
School's Back. Here's What Happened to Traffic, Speeding & Distraction
What happens to traffic when school resumes? New data analysis examines changes in distracted driving, congestion, and speeding around schools.
September 18, 2026
When school is back in session, roadway conditions change, too. New data shows shifts in distraction, speeding, and congestion around schools — particularly during the morning commute.
Credit:
School Bus Fleet
6 min to read
Schools across the U.S. are back in session again. Which means more traffic, more distractions, and more risk for both students and others on the roadway.
Three data reports have just dropped, revealing exactly what’s happening near school zones, from traffic patterns and travel times to the worst times for speeding and distractions.
Let’s dig in.
Morning Drop-Off Brings the Biggest Distracted Driving Spike
We already know that speeding is a real problem in school zones. Last April, the Insurance Institute for Highway Safety found that motorists who speed are more likely to use their phones while driving. Now, Cambridge Mobile Telematics (CMT) dug deeper.
CMT looked at distracted driving around 32 schools across the country to measure how distraction changed when the 2025 school year began. (In this analysis, distraction is defined as the rate of phone-tapping events per 100 miles driven on roads surrounding each school.)
The biggest change they saw occurred in the early morning. Across all schools studied, distraction increased an average of 45.6% between 6 and 8 a.m.; the same window that NHTSA flagged as deadliest for school-transportation crashes.
However, the size and timing of that increase varied considerably by school type, urban setting, and region.
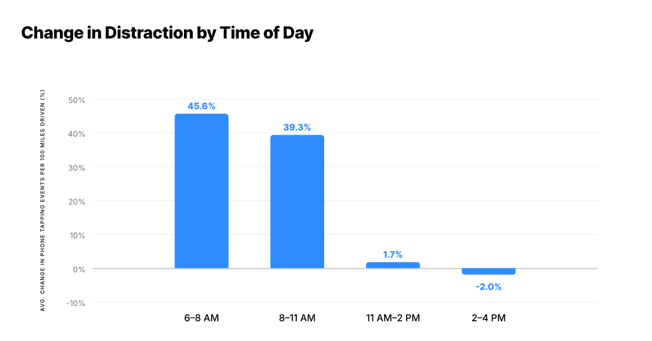
The morning drop-off period saw the largest increase in distraction after school started. By midday, it tapered off. Between 2 and 4 p.m., distraction fell an average of 2% below baseline.
Credit:
Cambridge Mobile Telematics
Urban and Non-Urban Schools See Different Patterns
CMT examined how distraction varied between urban and non-urban schools. Its sample included 16 of each, based on National Center for Education Statistics classifications.
There, the biggest difference came in the early morning. Between 6 and 8 a.m., distraction rose 55.8% around non-urban schools, compared to 35.5% around urban schools. From 8 to 11 a.m., the pattern reversed. Distraction around urban schools jumped 52.7%, more than double the 25.8% increase around non-urban schools.
After 11 a.m., distraction fell 7.3% below baseline at urban schools but stayed 10.8% above baseline at non-urban schools. By afternoon pickup, the pattern flipped again. Distraction around urban schools sat 4.5% above baseline, while non-urban schools were 8.6% below it.
“The difference in back-to-school road risk throughout the morning may come down to how people travel in each community,” CMT said in its analysis. “In non-urban areas, longer distances and greater reliance on cars may lead to more driving around school arrival times. In cities, morning school traffic blends with commuters, pedestrians, and public transit.”
Elementary Schools See a Larger Distraction Gap
CMT also identified a larger distracted driving gap around elementary schools versus high schools.
“How students get to and from school may help explain the difference,” they noted. “Elementary students are more likely to rely on adults for transportation, making drop-off and pickup a bigger part of the daily driving routine. High school students have more transportation options and may arrive and leave at different times.”
Timing Varies by Region
CMT also analyzed data between regions in the U.S. Schools in the Northeast saw the largest early-morning spike, with distraction rising 80.5% between 6 and 8 a.m. The Midwest saw a more sustained increase; there, distraction rose 42.8% from 6 to 8 a.m. and 26.3% from 8 to 11 a.m.
In the West, distraction increased just 5.8% from 6 to 8 a.m., then surged 104.2% between 8 and 11 a.m. — the largest increase of any region or time period analyzed.
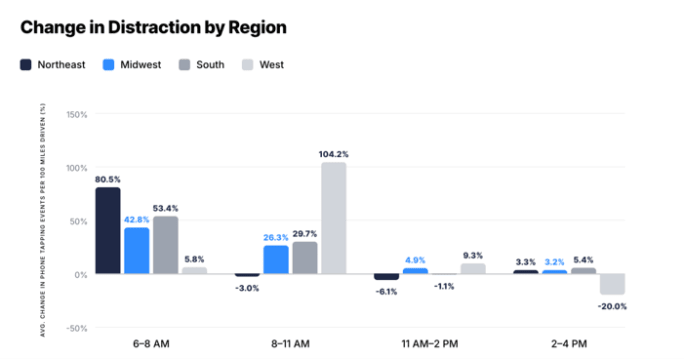
Despite regional differences, the largest jumps in distracted driving occurred before 11 a.m. across all four regions.
Credit:
Cambridge Mobile Telematics
Find the full analysis and list of schools studied online here.
School Traffic Can Reshape Congestion Around Individual Intersections
School drop-offs alone can generate 20% to 30% of morning traffic, smart mobility group Iteris reported. Earlier fall school starts, extended drop-off periods, and bus driver shortages exacerbate the problem.
A Texas School Gets More Time to Cross
At Rouse High School in Leander, Texas, Iteris worked with the City of Leander and Leander ISD to improve safety for students crossing a busy roadway. Iteris already works with the city to measure and improve key safety and mobility metrics through data analytics. The added challenge was coordinating crossing guards, pedestrians, and traffic signals when guards needed to enter the roadway.
An underused feature in the existing traffic signal controller that allows for customized pedestrian timing was identified. By modifying the controller programming, Iteris engineers and the city enabled trained crossing guards to activate an extended pedestrian interval by simply pressing and holding the pedestrian button for more than one second. At Rouse High School, this increased walk time from seven to 17 seconds and clearance time from 15 to 25 seconds, giving crossing guards more time to help students cross safely while working with the traffic signal rather than against it.
Traffic safety concerns can extend beyond the school zone. In San Antonio’s Stone Oak area, Iteris used ClearGuide traffic analytics near two middle schools and identified recurring speeding activity, with vehicles traveling more than 10 mph above the posted speed limit across multiple segments and times of day.
The analysis also found recurring spikes when nearly 100% of sampled vehicles exceeded the speed threshold.
One California Intersection Saw Delays Triple
Beyond pedestrian safety and speeding, back-to-school season can significantly change traffic conditions around intersections. At one intersection in Eastvale, California, westbound delay in 2025 reached 85 seconds at 9 a.m. during the month after Labor Day, compared with 46 seconds during July.
Early data from the 2026 school year shows an even sharper increase, with westbound delay at 8 a.m. reaching 86 seconds on school days compared with 28 seconds in July, more than tripling the summer delay.
The intersection also experienced a significant increase in split failures (vehicles having to wait through more than one signal cycle). At 8 a.m. on school days in 2026, the eastbound split-failure rate near Eleanor Roosevelt High School increased from 9% during the summer to a peak of 30%, meaning nearly one in three vehicles had to wait through more than one signal cycle to cross the intersection.
“Back-to-school traffic is highly predictable, but the resulting congestion can vary significantly from one intersection to another,” said Will Cousins, chief product officer at Iteris. “By comparing current conditions with historical patterns, transportation agencies can identify where traffic is changing, understand the severity of the impact, and determine where action may be needed before congestion becomes a larger operational issue.”
Can Traffic-Calming Measures Reduce Risk?
In New York City, one simple solution has emerged.
Geotab analyzed commercial fleet activity there to examine what traffic-calming measures do to driver behavior and journey times. They looked at more than 170,000 commercial vehicles, 256 million trips, and around 700 million miles across 1,992 schools and 32 districts.
Findings show that vehicles were around 5% less likely to speed on streets with speed humps than on comparable untreated streets. That could mean around five fewer speeding instances for every 100 vehicles on roads with speed humps, the company said.
Other findings include:
- Turn calming was associated with a 6.1% point fall in harsh cornering.
- Speed humps produced no increase in harsh braking, countering concerns that they create sudden braking hotspots.
- The effect on journey times was relatively small, adding around 8 to 12 seconds per mile.
Quick Answers
The resumption of school typically leads to increased traffic congestion as more parents drive their children to school, and school buses are active on the roads. This influx of vehicles contributes to denser traffic, especially during morning and afternoon peak times.
*Summarized by AI
More Safety
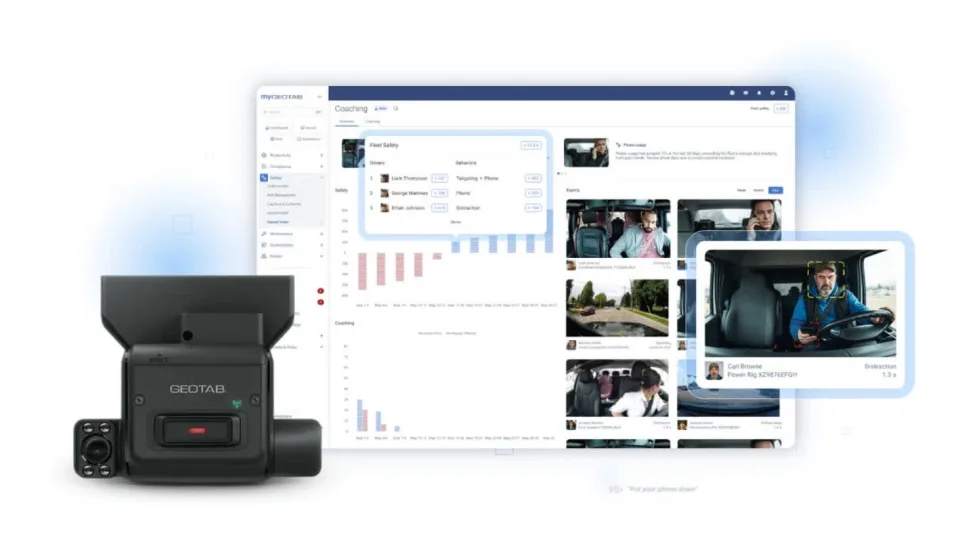
Geotab Expands Fleet Safety Tools With Video Coaching, Risk Insights
New safety and video capabilities aim to help fleet managers assess risk, support drivers, and take targeted action through video coaching, red-light violation detection, and more.
Read More →
How to Build a Better School Bus Driver Training Program
Is it time to strengthen your driver training? Here’s how to pick the right talent and improve recruitment, retention, and safety. This video is brought to you by IC Bus.
Read More →
Recent School Bus Accidents Leave 2 Dead, 2 Injured
Four school bus crashes in Florida, Illinois, and Georgia highlight risks in transportation lots, at bus stops, and during student loading and unloading.
Read More →
Sponsored•September 8, 2026
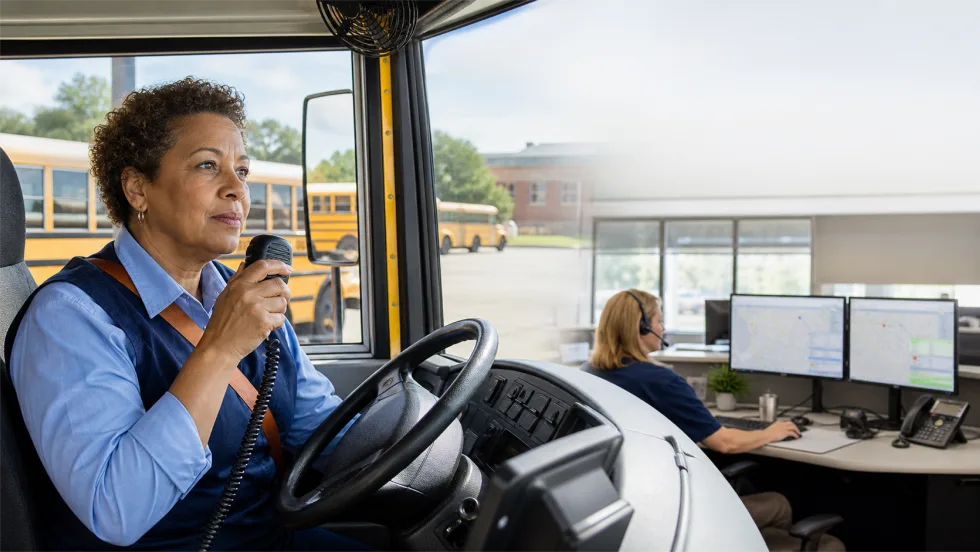
When Every Second Matters, Clarity Keeps Routes Moving
From routine delays to urgent incidents, strong communication practices help drivers, dispatchers, schools, and families respond with confidence.
Read More →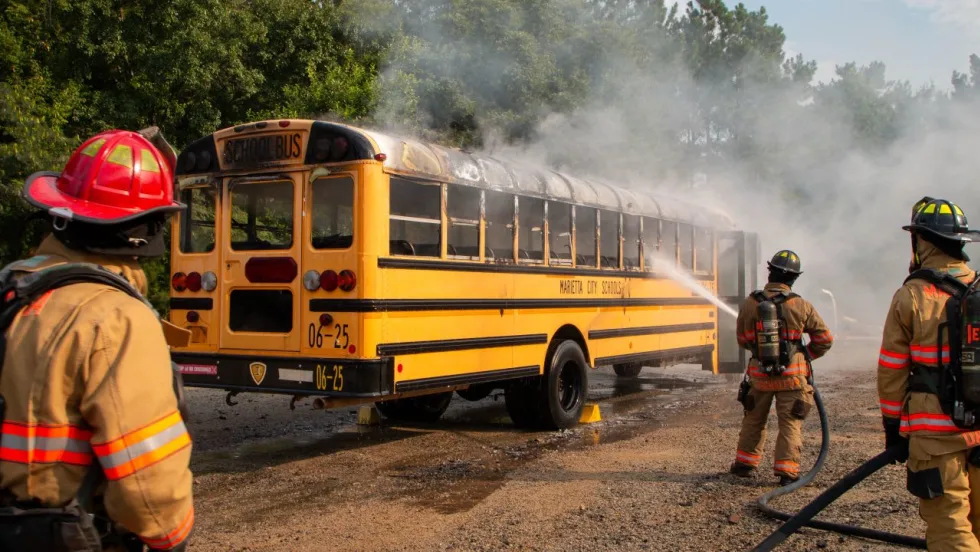
What Happens When a School Bus Catches Fire — and What Can Help
School bus fires are rare but can be devastating. Learn how advances in fire suppression and asset protection help fleets detect fires earlier, reduce damage, and improve safety.
Read More →
Geotab Launches Tool to Help Fleets Investigate Road Incidents
Geotab Investigations combines telematics data, video, documents, and other evidence to help fleets reconstruct incidents, resolve claims, and determine what happened.
Read More →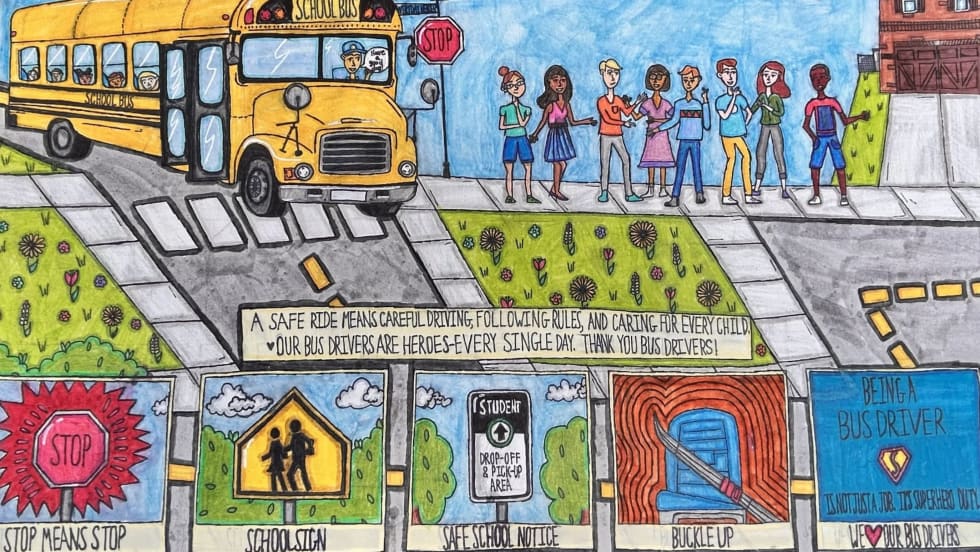
Texas Sixth Grader Wins 2026 National School Bus Safety Poster Contest
Sai Darshana Yekolu of Moseley Middle School in Prosper, Texas, was named the newest winner for her artwork, bringing the theme of “Safe Rides, Everyday Heroes” to life.
Read More →
Sponsored•August 27, 2026
Doing More With Less: How Transportation Directors Can Prioritize Safety Amid Budget Uncertainty
With diesel prices soaring and nearly one-third of transportation directors expecting budget cuts, maintaining student safety has never been more challenging. Download this guide to learn how leading districts are prioritizing risk, funding critical safety technology, and building stronger budget cases with data.
Read More →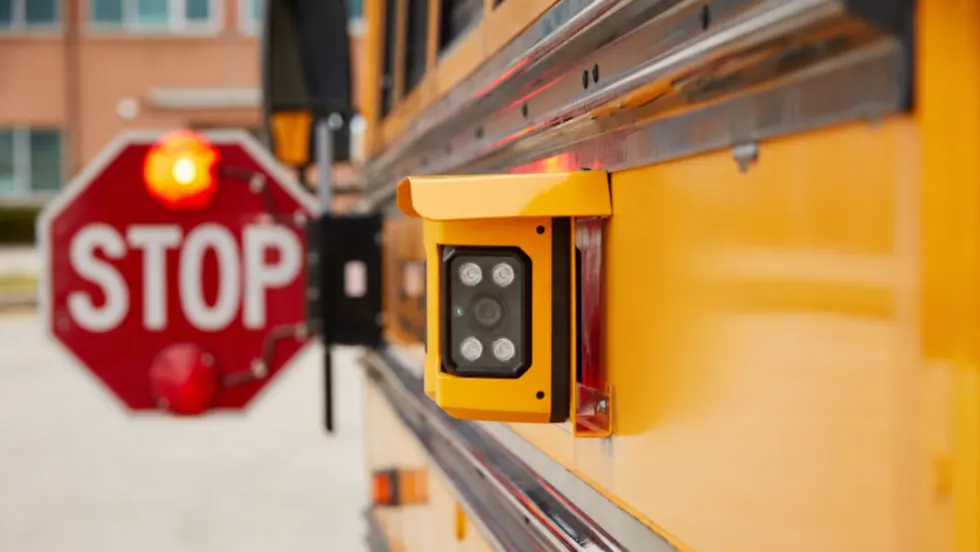
Walton County Schools Adds Gatekeeper Stop-Arm Enforcement System
The Florida district will deploy Gatekeeper’s updated Student Protector technology, which now incorporates AI to improve video evidence.
Read More →
How To Build a More Secure School Bus Yard During and After Hours
As thefts and overnight security threats continue, school transportation leaders are combining stronger operational practices with AI-enabled surveillance to better protect buses, facilities, and staff.
Read More →