

U.S. Traffic Fatalities Rose in 2015
The nation lost 35,092 people in traffic crashes in 2015 — a 7.2% increase compared to the previous year, according to federal data.

The nation lost 35,092 people in traffic crashes in 2015 — a 7.2% increase compared to the previous year, according to federal data.

The nation lost 35,092 people in traffic crashes in 2015 — a sharp increase compared to the previous year, according to federal data.
The final data released on Monday by the National Highway Traffic Safety Administration (NHTSA) showed traffic deaths rising across nearly every segment of the population, with a total 7.2% increase in 2015 compared to 2014.
The last single-year increase of this magnitude was in 1966, when fatalities rose 8.1% from the previous year.
“Despite decades of safety improvements, far too many people are killed on our nation’s roads every year,” U.S. Transportation Secretary Anthony Foxx said. “Solving this problem will take teamwork, so we’re issuing a call to action and asking researchers, safety experts, data scientists, and the public to analyze the fatality data and help find ways to prevent these tragedies.”
Ten years ago, the number of traffic deaths was nearly 25% higher, with 42,708 fatalities reported nationwide in 2005. Since then, according to NHTSA, safety programs have helped lower the number of deaths by increasing seat belt use and reducing impaired driving. Vehicle improvements, including air bags and electronic stability control, have reportedly also contributed to reducing traffic fatalities.
In response to the spike in deaths in 2015, the Department of Transportation, NHTSA, and the White House have called on a wide range of stakeholders to help determine the causes of the increase. NHTSA will share its Fatality Analysis Reporting System with safety partners, state and local officials, technologists, data scientists, and policy experts.
According to NHTSA, job growth and low fuel prices were two factors that led to increased driving, including increased leisure driving and driving by young people. More driving can contribute to higher fatality rates. In 2015, vehicle miles traveled increased 3.5% over 2014, the largest increase in nearly 25 years.
Pedestrian and pedalcyclist fatalities increased to a level not seen in 20 years. Motorcyclist deaths increased more than 8%.
NHTSA also noted that human factors continued to contribute to the majority of crashes. Almost half of the passenger vehicle occupants killed were not wearing seat belts. Also, research shows that almost one in three fatalities involved drunk drivers or speeding. Meanwhile, one in 10 fatalities involved distraction.
“The data tell us that people die when they drive drunk, distracted, or drowsy, or if they are speeding or unbuckled,” NHTSA Administrator Mark Rosekind said. “While there have been enormous improvements in many of these areas, we need to find new solutions to end traffic fatalities.”
More Safety
NHTSA Releases 10-Year Review of Fatal School Bus Crashes
The latest federal analysis reinforces the safety of school buses while identifying where school-age pedestrians and other motorists remain most at risk.
Read More →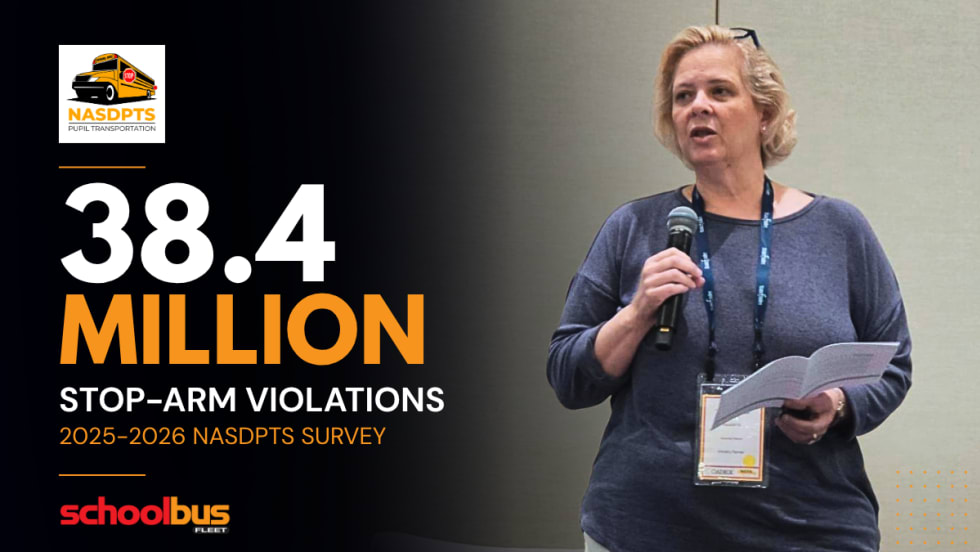
2026 NASDPTS Survey: Data Shows Further Reduction of Illegal Passing
New data is in! School bus stop-arm passings are down to 38.4 million violations per year, about a 2.3% decrease from last school year — but passings on the right side of the bus are higher than ever.
Read More →
Another School Bus Fatality Reported in Monsey, New York
A 7-year-old girl died after being struck by a school bus in Rockland County, New York while crossing the street. Here's what we know.
Read More →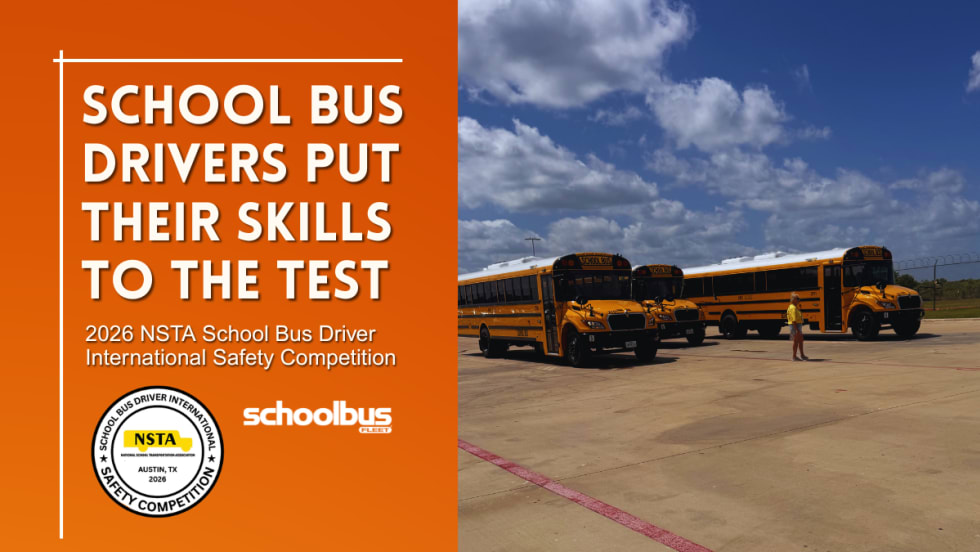
NSTA Announces 2026 School Bus Driver International Safety Competition Winners
Drivers from across the U.S. and Canada showcased their safety and driving skills, with two defending champions successfully retaining their titles.
Read More →
The Driver Shortage Playbook
Driver shortages are still a major challenge for student transportation fleets, but the real issue has shifted. It’s no longer just about filling seats quickly. It’s about finding safe, reliable drivers who meet performance expectations and want to stay. The Driver Shortage Playbook covers why traditional recruitment tactics are falling short and how school fleets are adapting with smarter hiring, stronger retention strategies and a greater focus on driver quality.
Read More →
Pro-Vision Launches AI-Powered 360° Camera System
The new Birdseye camera delivers real-time AI-based pedestrian and vehicle detections, full visibility around the bus, and telematics integrations.
Read More →
N.Y. & N.J. Coalitions Call for Modernized Transportation for Vulnerable Students
New statewide coalitions in New York and New Jersey are urging lawmakers to expand student transportation options for vulnerable students amid ongoing driver shortages.
Read More →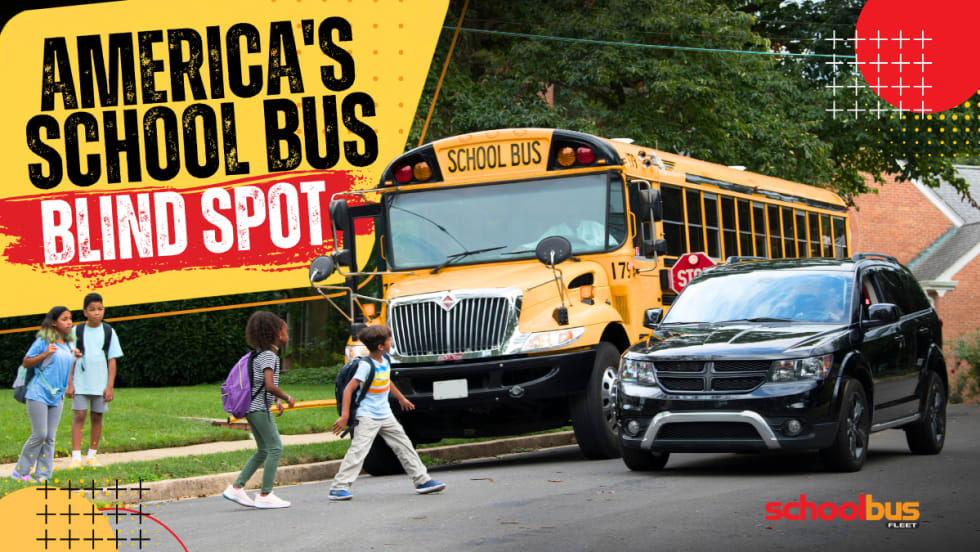
America Has a School Bus Passing Problem — and Distraction Is Making It Worse
Illegal school bus passing remains a major safety threat as distracted driving rises. This op-ed explores why awareness, enforcement, and stop-arm cameras matter more than ever.
Read More →
School Bus Laws to Watch: New York Delays EV Mandate
Plus, federal lawmakers seek new funding for school bus safety as states weigh stop-arm enforcement, disability protections, and education spending.
Read More →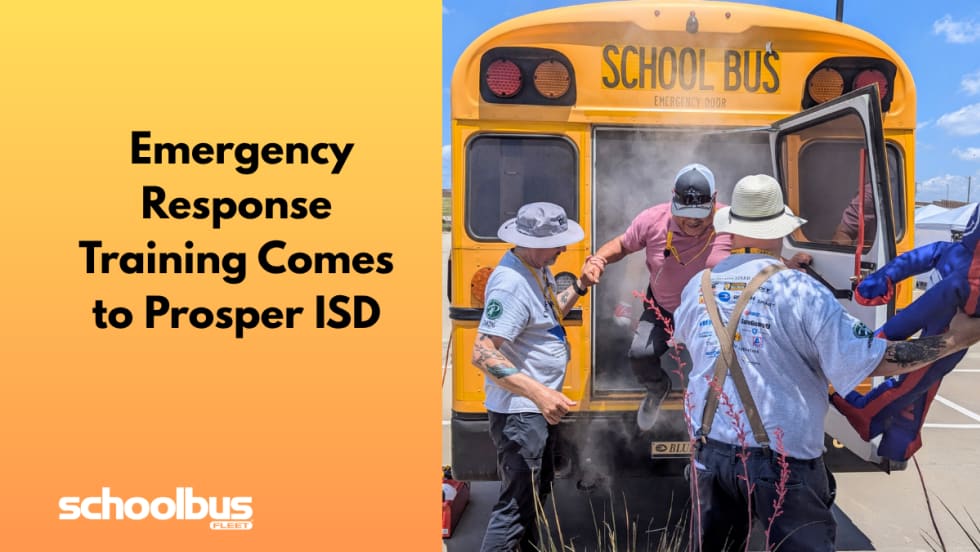
Operation STEER Brings Emergency Response Training to North Texas
Prosper ISD hosted the third annual training for transportation professionals across 67 districts to learn how to respond to emergencies, such as rollovers and evacuations, and proper use of safety equipment.
Read More →