

Stats show safer roads
According to the National Highway Traffic Safety Administration (NHTSA)'s latest Fatality Analysis Reporting System data, there were 33,561 highway deaths in 2012. While that was a 3% increase from 2011, NHTSA officials pointed out that highway deaths over the past five years continue to remain at historic lows.
Have the nation’s roads gotten safer or less safe over the past few decades?
With the proliferation of mobile devices — and the advent of such dangers as texting while driving — over the past 10 years or so, would you guess that there are more people being killed in motor vehicle crashes than there were 20 or 30 years ago?
When you’re out driving and you see people looking at their cell phones instead of the road, swerving in and out of lanes, and displaying other reckless behavior, it’s easy to get the sense that our roads have become more dangerous than they used to be.
Despite such anecdotal evidence, federal statistics actually show that our nation’s roads are far safer now than they used to be — that is, judging by the numbers of fatalities and injuries in motor vehicle crashes.
That surprising fact is made clear in data released recently by the National Highway Traffic Safety Administration (NHTSA).
Downward trends
According to NHTSA’s latest Fatality Analysis Reporting System data, there were 33,561 highway deaths in 2012. While that was a 3% increase from 2011, NHTSA officials pointed out that highway deaths over the past five years continue to remain at historic lows.
Fatalities in 2011 were at the lowest level since 1949. Even with the slight increase in 2012, the level of fatalities is the same as it was in 1950.
Going back to the late ’60s and early ’70s, there were consistently more than 50,000 highway deaths per year — that’s about 50% higher than the 2012 total, 33,561.
A key factor in comparing fatalities from year to year is the number of miles driven. A chart in NHTSA’s recent report (available at www-nrd.nhtsa.dot.gov/Pubs/811856.pdf) shows the annual fatality rates by 100 million vehicle miles traveled, all the way back to 1963.
In that year, the rate was 5.18 fatalities per 100 million vehicle miles. In the half century since then, the highway fatality rate has fairly steadily declined. In 2012, it was down to 1.14 deaths per 100 million vehicle miles.
The injury rate has also been decreasing over the past few decades. In 1988, the rate was 169 people injured per 100 million vehicle miles traveled. In 2012, it was about half of that — 80 people injured per 100 million vehicle miles.
Dangers remain
Of course, the fact that highway deaths and injuries are down doesn’t mean we can rest on our laurels.
In the pupil transportation business, the problem of motorists illegally passing school buses continues to endanger our students. The latest national stop-arm running survey found 85,279 violations in a single day. This issue calls for enhanced enforcement of stop-arm laws, more public awareness efforts and continued training and vigilance.
While there will always be some degree of danger on our nation’s roads, it’s at least reassuring to know that, overall, highway safety has been improving.
Not everything is worse than it used to be.
More Safety

The Driver Shortage Playbook
How student transportation fleets are hiring, retaining and adapting .
Read More →
Pro-Vision Launches AI-Powered 360° Camera System
The new Birdseye camera delivers real-time AI-based pedestrian and vehicle detections, full visibility around the bus, and telematics integrations.
Read More →
N.Y. & N.J. Coalitions Call for Modernized Transportation for Vulnerable Students
New statewide coalitions in New York and New Jersey are urging lawmakers to expand student transportation options for vulnerable students amid ongoing driver shortages.
Read More →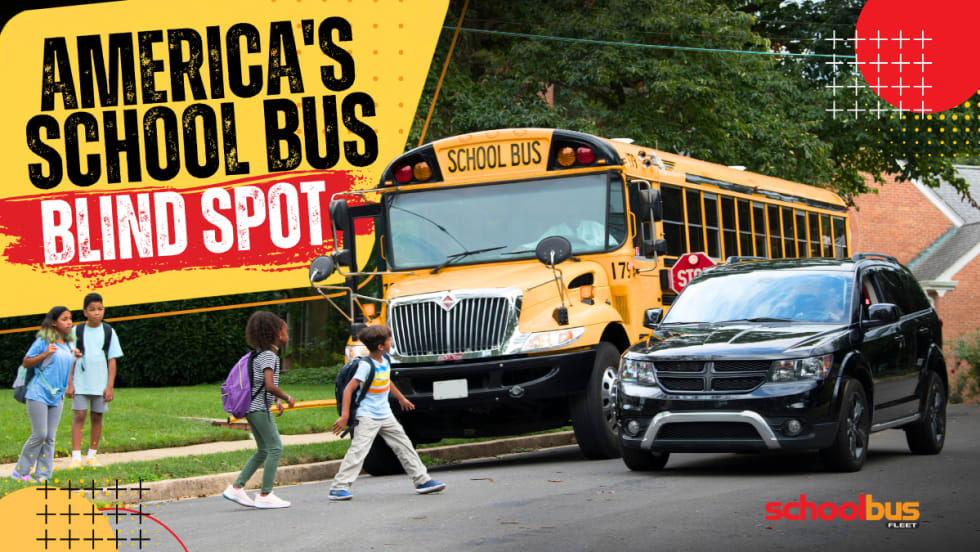
America Has a School Bus Passing Problem — and Distraction Is Making It Worse
Illegal school bus passing remains a major safety threat as distracted driving rises. This op-ed explores why awareness, enforcement, and stop-arm cameras matter more than ever.
Read More →
School Bus Laws to Watch: New York Delays EV Mandate
Plus, federal lawmakers seek new funding for school bus safety as states weigh stop-arm enforcement, disability protections, and education spending.
Read More →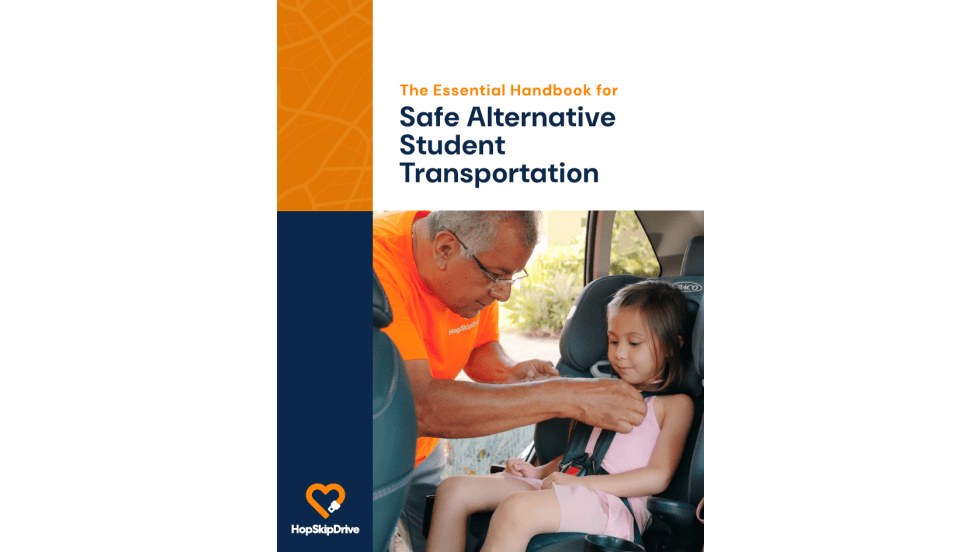
The Essential Handbook for Safe Alternative Student Transportation
Your district's "exception riders" — students with IEPs, those experiencing homelessness, foster care youth — deserve more than a middleman solution. This handbook breaks down exactly what to look for in a supplemental transportation partner: from driver vetting and regulatory compliance to proactive safety technology. Because getting a ride isn't the same as getting a safe one.
Read More →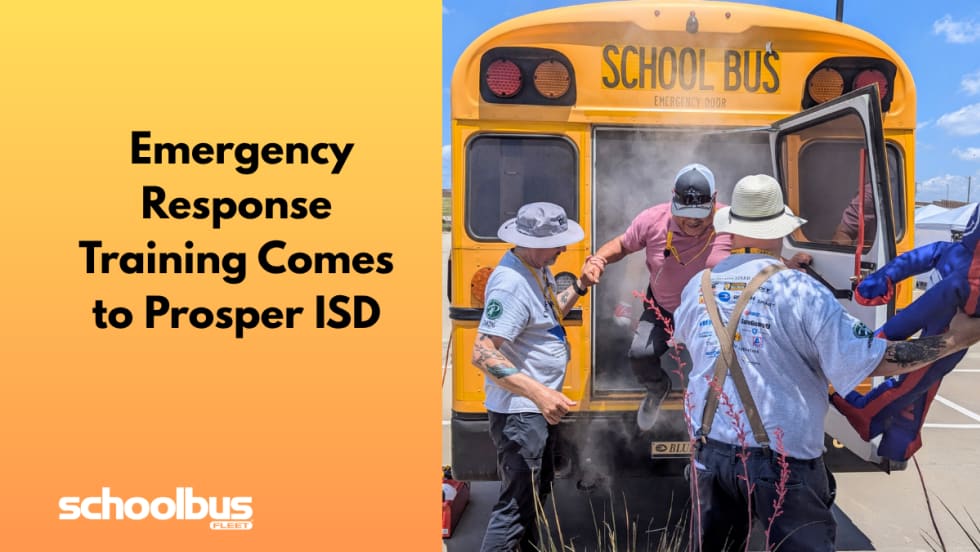
Operation STEER Brings Emergency Response Training to North Texas
Prosper ISD hosted the third annual training for transportation professionals across 67 districts to learn how to respond to emergencies, such as rollovers and evacuations, and proper use of safety equipment.
Read More →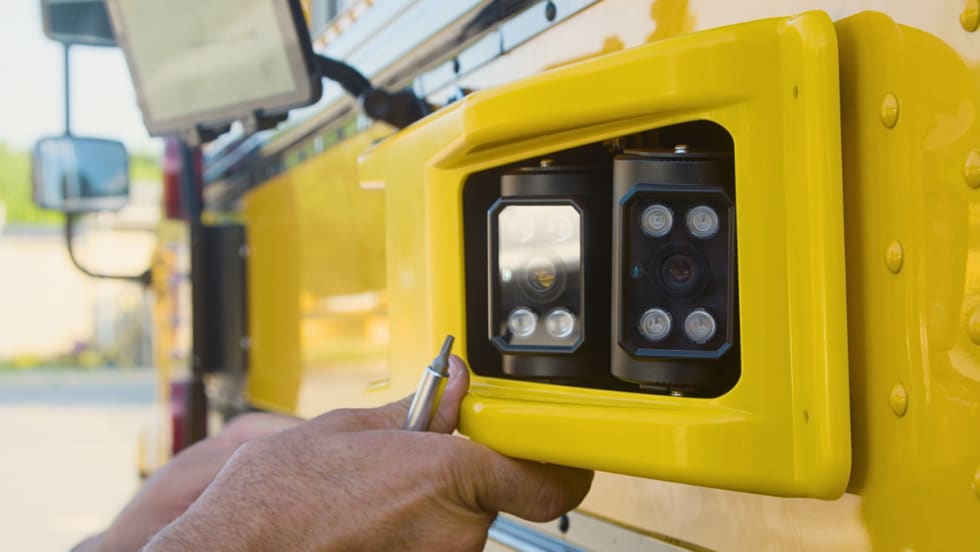
Florida District Relaunches BusPatrol School Bus Camera Program With New Safeguards
After being suspended over due process concerns, Miami-Dade schools and law enforcement are restarting the AI-powered stop-arm camera program with new oversight.
Read More →
School Bus Laws To Watch: Seat Belt Bills, Funding Fights & EV Changes
From national bills on seat belts and driver oversight to driver awareness campaigns referencing “Finn’s Rule” and ongoing transportation funding debates in Alaska, here’s the latest in school bus legislation across the U.S.
Read More →
9-Year-Old Boy Killed by School Bus at Busy Brooklyn Intersection
A Williamsburg community is mourning after a child was fatally struck by a private yeshiva bus, prompting calls for urgent safety improvements at the high-traffic crossing.
Read More →