


Last Year's Results: Top District Fleets: Georgia District Holds Top Spot for Second Year
Rolling Toward Success: The Top School District Fleets of 2024
Higher pay for drivers and growing interest in alternative fuels such as all-electric school buses are among the findings of the latest School Bus Fleet annual survey.
October 14, 2024
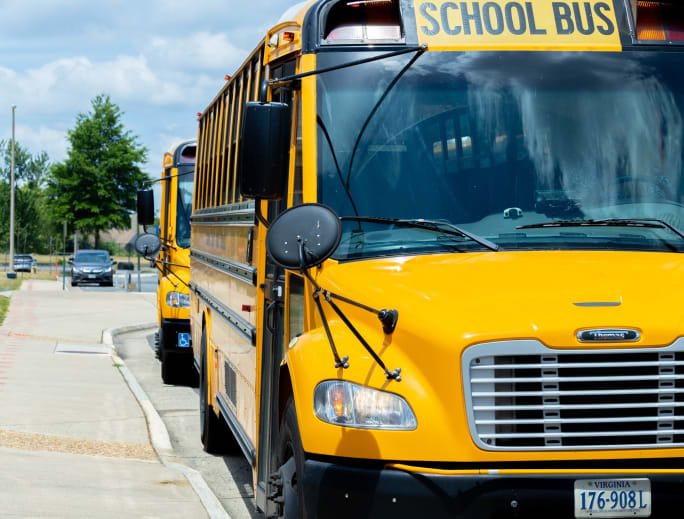
In a district in Virginia, adding additional office staff and implementing a new bus transfer model were strategies to try and cope with strain.
Photo: Stafford County Public Schools
5 min to read
As school districts across the country adapt to growth and increasing academic demands, School Bus Fleet’s latest survey of district transportation services reveals that many are navigating the effects of the ongoing nationwide shortage of qualified transportation professionals.
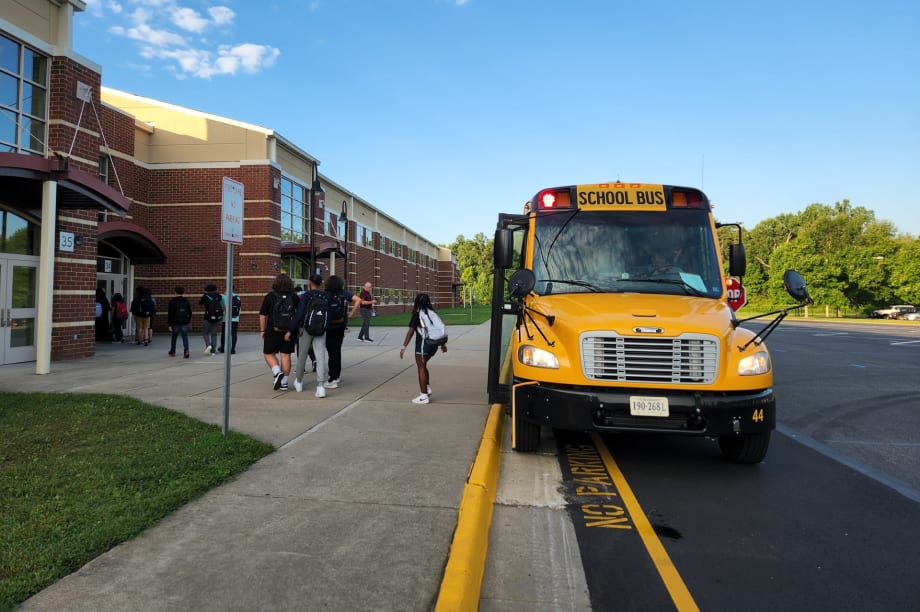
Among those feeling the strain is Stafford County Public Schools in Virginia, where transportation leaders are finding both challenges and triumphs amid the shortage.
"Stafford County Public Schools continues to experience the effects from the nationwide school transportation professional shortage," said Karim Johnson, executive director for transportation services and a former SBF Administrator of the Year. "This includes not just bus drivers, but also the essential bus attendants needed to meet the requirements of students’ Individualized Education Programs (IEPs) and Head Start needs. Without this critical member of the team, the bus route cannot roll safely."
Stafford County is one of the fastest-growing school systems in Virginia, adding pressure to an already stretched transportation network. Johnson and his team have implemented several innovations to maintain safety and efficiency despite these hurdles. One involves transitioning from identifying buses by fleet numbers to using route numbers. Additionally, the district introduced a new transfer bus model to support its High School Specialty Centers, enabling transportation for system-wide open enrollment programs.
"We were able to deploy this system despite the challenges from the nationwide shortage," Johnson explains. Stafford County has also expanded its office staff, adding specialists and coordinators to help support students, families, and bus drivers alike.
As districts like Stafford County grapple with growth and staffing shortfalls, the SBF survey underscores the ongoing importance of innovation and adaptation in school transportation services.
5 Takeaways from the SBF Top District Fleets Survey Data
Increased Starting Pay for Bus Drivers: A significant 69% of districts reported an increase in starting hourly pay for drivers compared to the previous year. The average hourly wage increased by $1.12, reaching $22.96, reflecting efforts to improve recruitment and retention amid the driver shortage.
Slight Improvement in Driver Shortage: While driver shortages remain a significant challenge, the percentage of districts reporting moderate to severe shortages has dropped from 63% to 51%. Also, 15% of districts reported no shortage, up from last year, indicating some progress in addressing this issue.
Growing Interest in Electric Buses: Purchases of all-electric buses increased by 7% between 2023 and 2024. Districts also expanded their use of electric buses in fleets, growing from 8% to 13%. While diesel remains dominant, the shift toward electrification signals a growing focus on sustainability.
Minimal Bell Schedule Changes Due to Shortages: Despite the persistent driver shortage, 83% of districts reported no changes to their bell schedules, suggesting that most districts are managing their transportation needs without significantly altering school start times.
Awareness of Clean School Bus Funding, but Limited Application: While 90% of districts are aware of the EPA’s Clean School Bus Program, only 38% of districts applied for funding. Notably, 50% of those aware of the program chose not to apply, indicating potential barriers or hesitancy in pursuing available resources.
In Virginia, Stafford County buses now go by route numbers instead of fleet numbers.
Photo: Stafford County Public Schools
Top 5 Districts Based on Route Buses
| Rank | District | # of Route Buses |
| 1 | Gwinnett County (Ga.) Public Schools | 1,592 |
| 2 | Cobb County (Ga.) Public Schools | 770 |
| 3 | Orange County (Fla.) Public Schools | 700 |
| 4 | Fulton County (Ga.) Public Schools | 695 |
| 5 | Palm Beach (Fla.) Public Schools | 755 |
Top 5 Districts Based on Student Ridership
| Rank | District | Students Transported Daily |
| 1 | Gwinnett County (Ga.) Public Schools | 131,369 |
| 2 | Fulton County (Ga.) Schools | 76,000 |
| 3 | Cobb County (Ga.) Schools | 60,000 (Tie) |
| 4 | Palm Beach County (Fla.) Schools | 60,000 (Tie) |
| 5 | Orange County (Fla.) Public Schools | 54,000 |
| 6 | Albuquerque (N.M.) Public Schools | 32,949 |
Top 25 School District Fleets Overall
*based on districts that participated in the survey; data as submitted by Aug. 12, 2024.
| Rank | District | Total Buses | Total in Daily Operation | Contractor Buses | Students Transported | Annual Route Mileage |
| 1 | Gwinnett County (Ga.) Public Schools | 2,006 | 1,592 | 0 | 131,369 | 24,000,000 |
| 2 | Cobb County (Ga.) Public Schools | 1,027 | 1,027 | 0 | 60,000 | 10,000,000 |
| 3 | Fulton County (Ga.) Public Schools | 935 | 695 | 0 | 76,000 | 1,200,000 |
| 4 | Orange County (Fla.) Public Schools | 900 | 700 | 0 | 54,000 | 12,819,939 |
| 5 | Palm Beach (Fla.) Public Schools | 755 | 755 | 20 | 60,000 | 13,200,000 |
| 6 | Cherokee County (Ga.) School District | 465 | 372 | 0 | 28,000 | 6,200,000 |
| 7 | Albuquerque (N.M.) Public Schools | 426 | 309 | 55 | 32,949 | 4,077,691 |
| 8 | St. Lucie (Fla.) Public Schools | 390 | 296 | 0 | 22,000 | 6,500,000 |
| 9 | Stafford County (Va.) Public Schools | 375 | 300 | 0 | 28,000 | Unknown |
| 10 | Beaverton (Ore.) School District | 315 | 262 | 0 | 23,793 | 2,468,355 |
| 11 | Bossier (La.) Schools | 301 | 216 | 0 | 13,874 | 2,408,151 |
| 12 | Leander Independent School District (Texas) | 300 | 175 | 0 | 12,000 | 3,000,000 |
| 13 | Johnston County (N.C.) Public Schools | 274 | 239 | 0 | 24,463 | 4,198,914 |
| 14 | Corona Norco Unified School District (Calif.) | 220 | 185 | 220 | 3,300 | 2,200,000 |
| 15 | Deer Valley Unified School District (Ariz.) | 200 | 160 | 0 | 8,000 | 1,000,000 |
| 16 | Concord (Calif.) School District | 200 | 170 | 80 | 8,000 | 2,200,000 |
| 17 | Lamar County (Colo.) School District | 180 | 150 | 70 | 7,000 | 2,000,000 |
| 18 | North Penn (Penn.) School District | 176 | 145 | 53 | 13,000 | 2,100,000 |
| 19 | Collierville (Tenn.) Schools | 170 | 150 | 170 | 9,000 | 2,000,000 |
| 20 | Hilliard City (Ohio) Schools | 158 | 138 | 0 | 10,800 | 1,905,000 |
| 21 | East Allen County (Ind.) Schools | 153 | 95 | 0 | 8,500 | 1,200,000 |
| 22 | Putnam City (Okla.) Schools | 150 | 90 | 0 | 8,000 | 1,100,000 |
| 23 | Berkeley (Calif.) Unified School District | 130 | 110 | 50 | 5,500 | 1,600,000 |
| 24 | Christian County (Ky.) Schools | 110 | 86 | 0 | 8,500 | 1,800,000 |
| 25 | West Orange (N.J.) Public Schools | 100 | 100 | 60 | 4,200 | Unknown |
Average No. of Buses Per District
107
A significant drop from last year’s count of 292, but likely due to missing data from non-responders.
Average Student Passengers Per District
5,969
Down 8,611 from last year – possibly due to missing data but may indicate anecdotal trends of lowered ridership.
Total Annual Route Miles Driven by Responding Districts
185,186,773
Average Annual Route Miles Driven by Responding Districts
1,122,344
Average No. of Bus Drivers Per Responding District
83. Down slightly from 97 last year.
Average Bus Driver Hourly Wage
$22.96
The average hourly wage rose $1.12 from last year’s $21.84.
Labor Union Membership
Yes: 47%
No: 53%
Just over half (53%) of responding school districts reported that their employees are not unionized, but those that have organized are up from 33% in 2023.
Pupil Transportation Director Average Salary
$79,789
Compared to Last Year, Starting Hourly Pay for Drivers
Higher: 69%
Same: 30%
Lower: 1%
Planned Service Level Changes for 2024-25
Increased: 34%
Same: 58%
Lower: 8%
Driver Shortage Pain Per Responding District
No Shortage: 15%
Mild (1-5% short): 34%
Moderate (6-10% short): 28%
Severe (11-15%): 16%
Desperate (16%+ short): 7%
The percentage of responding districts reporting moderate to desperate levels of driver shortage fell compared to last year (51% rather than 63%). The percentage of districts indicating no pain from driver shortages rose to 15%.
Altered Bell Schedules Due to Driver Shortage
Yes: 14%
No: 83%
Not Sure: 3%
Most responding school districts didn’t change their bell schedules to accommodate routes due to the ongoing nationwide school bus driver shortage.
Purchased New Buses for 2024-25 School Year?
Yes: 57%
No: 43%
Fuel Types of New Purchased Buses
2023
Diesel: 71%
Gasoline: 19%
Propane: 12%
CNG: 4%
All-electric: 9%
Other: 12%
2024
Diesel: 76%
Gasoline: 19%
Propane: 12%
CNG: 3%
All-electric: 16%
Other: 11%
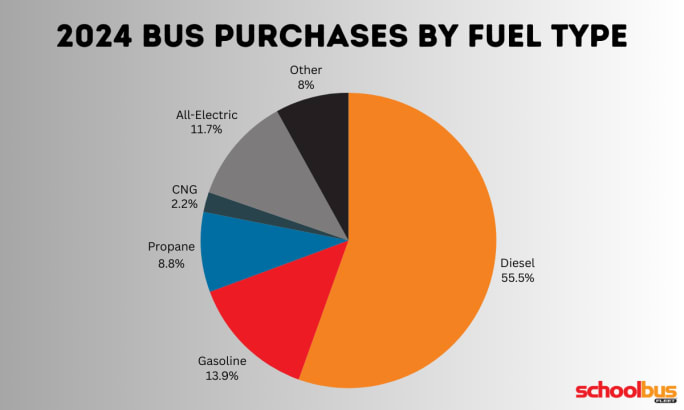
New diesel purchases appeared to increase between 2023 and 2024. Gasoline and propane held steady, while all-electric sales went up by 7%.
Photo: SBF/Canva
Fuels Used in District Fleets
2023
Diesel: 91%
Gasoline: 52%
Propane: 21%
CNG: 4%
All-Electric: 8%
Other: 1%
2024
Diesel: 92%
Gasoline: 55%
Propane: 10%
CNG: 6%
All-electric: 13%
Other: 2%
Diesel, gasoline, and all-electric buses gained prominence in school district fleets during the past year. Propane lost ground.
Use Rider/Bus Status Tracking Apps?
Yes: 48%
No: 50%
Not Sure: 2%
Almost half (48%) of responding school districts use smartphone applications, up from 39% last year.
Aware of EPA’s Clean School Bus Program?
Yes: 90%
No: 6%
Not Sure: 4%
Most responding school districts (90%) indicated they knew about the program — up slightly from last year.
Applying for Clean School Bus Funds?
Yes: 38%
No: 50%
Not Sure: 12%
Half the respondents (50%) who knew about EPA funding said they wouldn’t apply, a drop from last year.
Did You Apply for Clean School Bus Funding as a Prioritized School District?
Yes: 48%
No: 24%
Not Sure: 28%
Of responding districts applying for funds, almost half (48%) classified themselves as prioritized for funding.
Subscribe to Our Newsletter
More Management

Changing Lanes: AMF Bruns, Pro-Vision, CALSTART, HopSkipDrive, & Kooner
Check out who's been hired, promoted, and appointed to leadership positions at various school transportation industry suppliers and nonprofits.
Read More →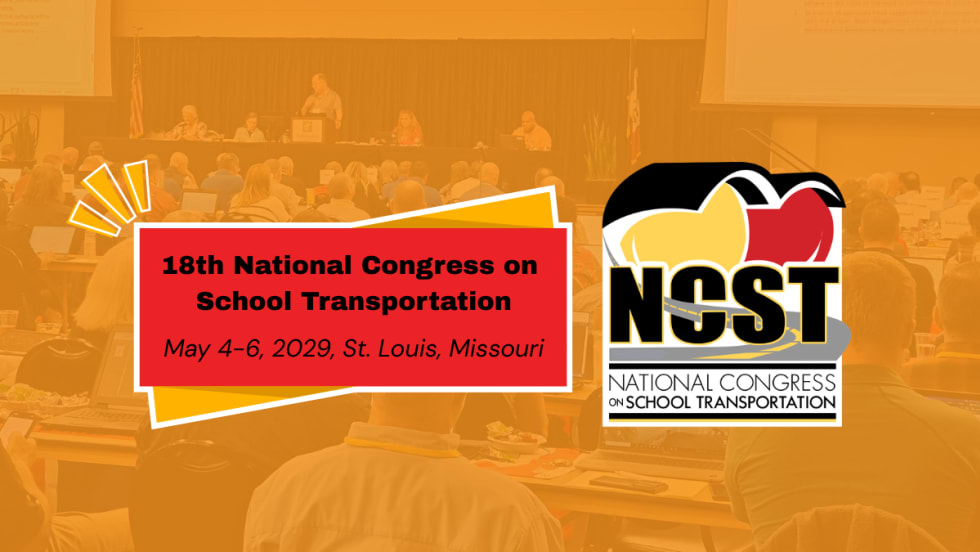
NCST Announces 18th Congress Event Dates, New Committees
The National Congress on School Transportation moves to St. Louis in May 2029, convening delegates and industry representatives to discuss new best practice recommendations. Now, the new committee chairs have been named.
Read More →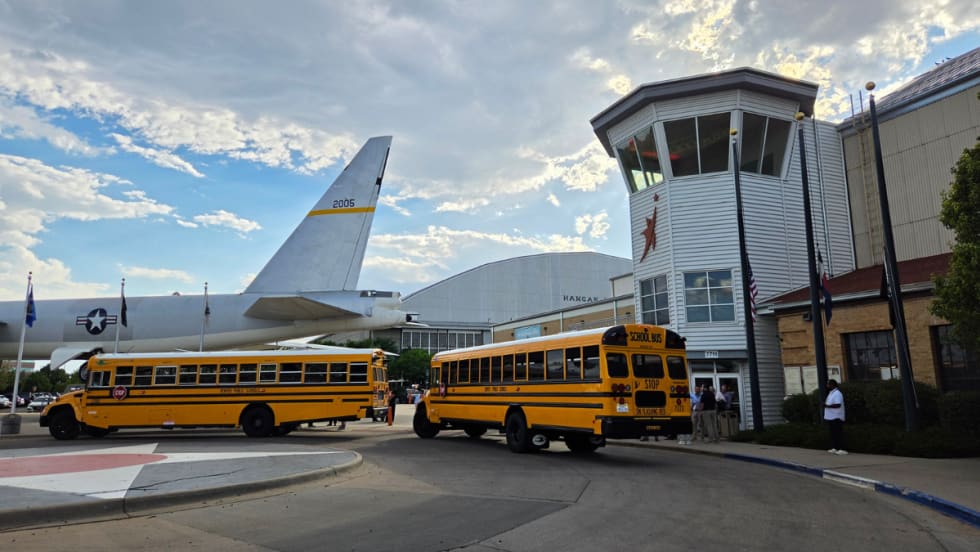
Key Moments from the 2026 NSTA Annual Meeting in the Mile High City
From federal policy updates and OEM presentations to speed networking and industry awards, see photos and highlights from the contractor association’s summer conference in Denver.
Read More →

HopSkipDrive Launches Spanish-Language App Update, Plans Additional Language Support
The update aims to improve communication with multilingual families by offering ride tracking, notifications, and support in Spanish, with more languages planned for the 2026-2027 school year.
Read More →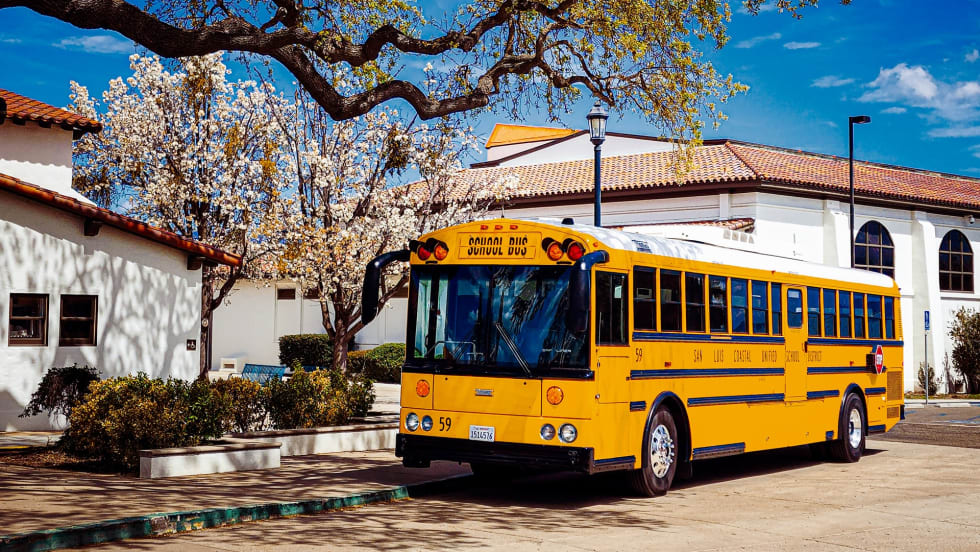
Where the Yellow Bus Takes Us: School Bus Fleet's 2026 Photo of the Year Winners
See the winning photos from School Bus Fleet's 2026 Photo of the Year contest, featuring stunning school bus images from across the U.S., from scenic landscapes to everyday moments.
Read More →
Why Emotional Intelligence Matters in Student Transportation
Learn the five key elements that bus drivers and transportation directors can use to stay calm in any situation.
Read More →
Sponsored•July 23, 2026
2026 Back-To-School Readiness Report
Staffing gaps, flat budgets, and the distance between “mostly prepared” and ready for the 2026-2027 school year.
Read More →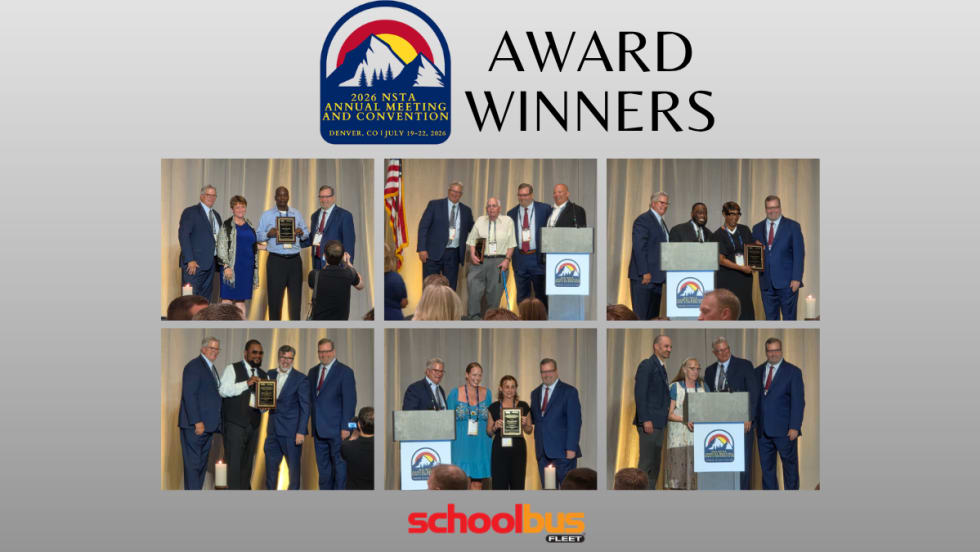
National School Transportation Association Presents 2026 Award Winners
Twenty-one individuals and contractor companies were recognized for excellence in student transportation at NSTA's annual meeting and convention in Denver.
Read More →
School Transportation Data Is Only as Powerful as the Story It Tells
Leaders say turning operational metrics into student-centered narratives can help districts justify investments and improve service.
Read More →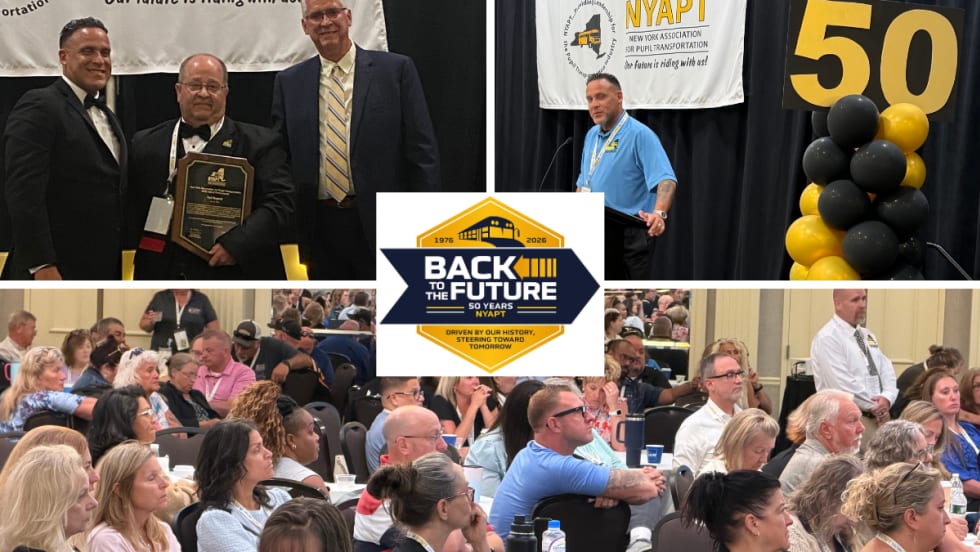
Photos: NYAPT Celebrates 50 Years at 2026 Conference & Trade Show
See highlights from NYAPT's 50th anniversary conference in Saratoga Springs, featuring educational sessions, awards, a trade show, networking, and more.
Read More →