

Study: Cost of motor vehicle crashes tops $99 billion
Teens and young adults made up 28 percent of all fatal and non-fatal motor vehicle injuries and 31 percent of the costs ($31 billion). Recommendations to prevent accidents include graduated driver licensing policies, child safety seat distribution, primary seat belt laws and enforcement, helmet laws and sobriety checkpoints.

In a one-year period, the cost of medical care and productivity losses associated with injuries from motor vehicle crashes exceeded $99 billion — with the cost of direct medical care accounting for $17 billion — according to a study by the Centers for Disease Control and Prevention (CDC).
The total annual cost amounts to nearly $500 for each licensed driver in the U.S., said the study in the journal Traffic Injury Prevention.
The one-year costs of fatal and non-fatal crash-related injuries totaled $70 billion (71 percent of total costs) for people riding in motor vehicles, such as cars and light trucks, $12 billion for motorcyclists, $10 billion for pedestrians and $5 billion for bicyclists, the study said.
CDC researchers used 2005 data because, at the study time, it provided the most current source of national fatal and non-fatal injury and cost data from multiple sources.
"Every 10 seconds, someone in the U.S. is treated in an emergency department for crash-related injuries, and nearly 40,000 people die from these injuries each year," said Dr. Grant Baldwin, director of CDC's Division of Unintentional Injury Prevention, National Center for Injury Prevention and Control. "This study highlights the magnitude of the problem of crash-related injuries from a cost perspective, and the numbers are staggering."
The study also found:
• Costs related to fatal motor vehicle-related injuries totaled $58 billion. The cost of non-fatal injuries resulting in hospitalization amounted to $28 billion, and the cost of injuries to people treated in emergency departments and released was $14 billion.
• More men were killed (70 percent) and injured (52 percent) in motor vehicle crashes than women. Injuries and deaths among men represented 74 percent ($74 billion) of all costs.
• Teens and young adults made up 28 percent of all fatal and non-fatal motor vehicle injuries and 31 percent of the costs ($31 billion). These young people represented only 14 percent of the U.S. population.
• Motorcyclists made up 6 percent of all fatalities and injuries but 12 percent of the costs, likely due to the severity of their injuries. Pedestrians, who have no protection when they are hit by vehicles and are also often severely injured, made up 5 percent of all injuries but 10 percent of total costs.
Motor vehicle crash injuries and deaths and the associated costs are preventable. CDC's Injury Center supports proven, effective strategies for prevention such as:
• Graduated driver licensing (GDL) policies: These laws allow new teen drivers to get experience on the road in lower-risk situations as they gain experience over time. Strong GDL laws have been associated with up to 40 percent decreases in crashes among 16-year-old drivers.
• Child safety seat distribution and education programs: Increased use of correctly installed and fitted child safety seats could help reduce the $3.6 billion annual bill for injuries to children, the cost number found in this study.
• Primary seat belt laws: These laws allow motorists to be stopped and cited for not wearing seat belts. Seat belts reduce the risk of death to those riding in the front seat of cars by about half.
• Enhanced seat belt enforcement programs: Enhanced enforcement programs in which law enforcement officers focus on getting people to buckle up (e.g., Click It or Ticket) are effective at increasing safety belt use and reducing deaths and injuries.
• Motorcycle and bicycle helmet laws: Helmets can reduce the risk of death in a motorcycle crash by more than one-third and reduce the risk of brain injury by 69 percent.
• Sobriety checkpoints: These checkpoints, where drivers are stopped to assess their level of alcohol impairment, can reduce alcohol-related crash deaths by more than 20 percent.
For details on state-specific policies and a state-by-state policy comparison, visit www.iihs.org/laws.
CDC has also released a one-page fact sheet to help communities play an important role in reducing the human and economic toll of motor vehicle-related injuries by supporting prevention policies that have been shown to save lives and reduce costs. It provides information about cost-effective policies to improve child passenger safety, improve teen driver safety, reduce alcohol-impaired driving and increase safety belt use.
For a complete copy of the CDC study, go to www.informaworld.com/smpp/section?content=a926084087&fulltext=713240928.
More Management
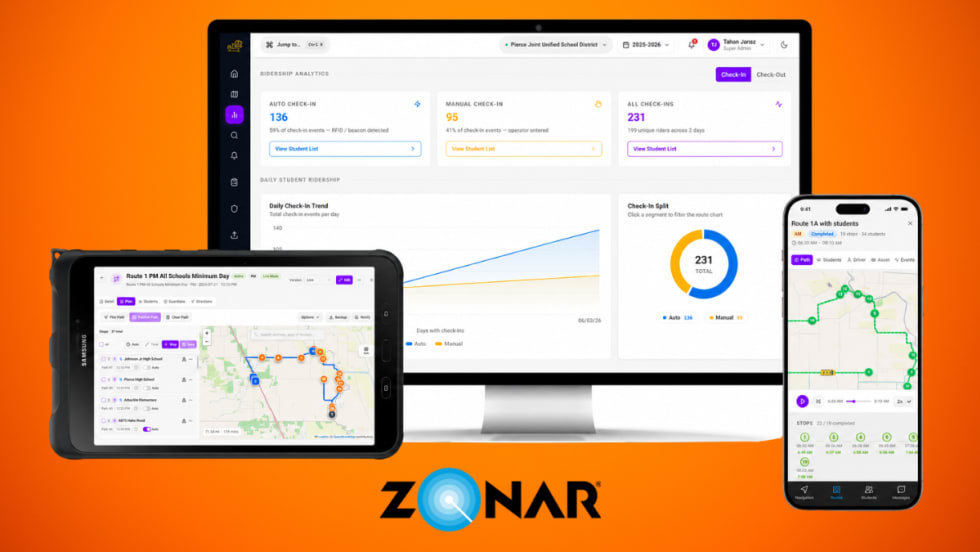
Zonar Launches Reimagined Bus Suite Web Portal
Can one platform replace your transportation software stack? Zonar says its new Bus Suite unifies routing, dispatch, field trips, GPS, and parent communication.
Read More →
Indiana Association Announces 2026 Award Winners
See who earned top honors at the 2026 School Transportation Association of Indiana conference, recognizing excellence in school transportation statewide.
Read More →
Student Transportation of America Acquires Massachusetts Contractor
Tremblay’s Bus Company and its 400-bus fleet joins the STA family of brands as the company grows its presence across the Northeast U.S.
Read More →


Michigan Association Announces 2026 Award Winners
See who earned top honors at the 2026 Michigan Association for Pupil Transportation conference, recognizing excellence in school transportation statewide.
Read More →
Inside MAPT 2026: Michigan’s School Transportation Community Connects at Boyne Mountain
Check out highlights from the 2026 MAPT Summer Conference, where over 300 transportation pros gathered for training, networking, awards, and trade show.
Read More →
Summit School Services to Complete Fleetwide Samsara Technology Rollout
The company said outfitting its entire fleet with AI-powered safety and fleet management technology will strengthen student safety and operational efficiency across its local brands.
Read More →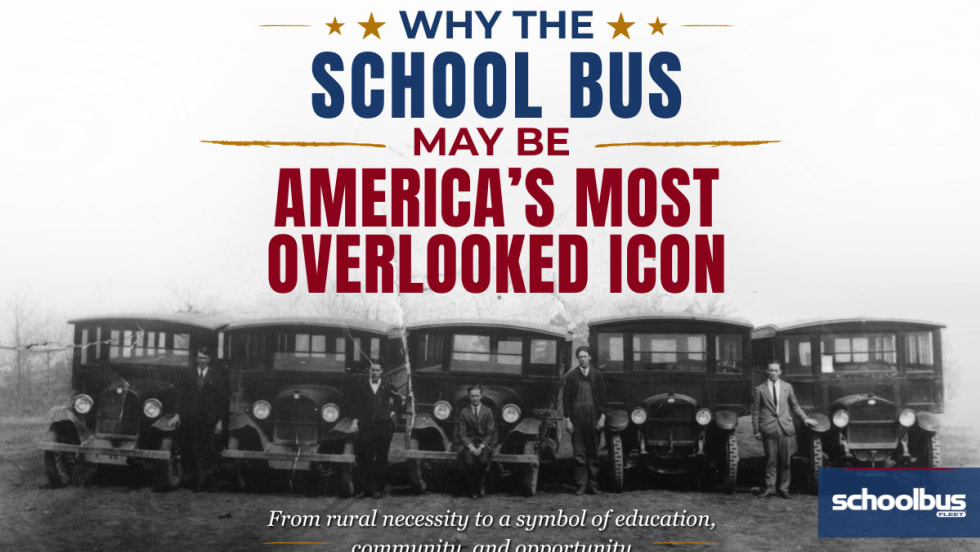
Why the School Bus May Be America's Most Overlooked Icon
Every day, millions of students climb aboard. But few realize the yellow school bus has helped transform education, connect communities, and come to symbolize civic responsibility.
Read More →
Why More Drivers Won’t Fix the Shortage
Hiring isn’t enough. Learn how leading fleets are solving driver shortages through smarter retention, training, and culture strategies.
Read More →
SBFX Keynote Announced: Ann Vote to Share Tips on Leadership and Team Culture
Find out who will be providing this year's keynote at SBFX in Scottsdale this September and what else to expect. District and contractor bus operators are invited to apply and attend at no cost!
Read More →
The School Bus as an American Icon: Exploring the Past, Present, and Future of the Yellow Bus
As America approaches its 250th anniversary, Blue Bird's Brad Beauchamp explores the history of the yellow school bus, its impact on education, and where student transportation is headed next.
Read More →