

Report: Education Revenue Rose 3.3% in 2014
The increase in U.S. education revenue was the largest since 2008. Meanwhile, pupil transportation accounted for 3.9% of total education spending in 2014.

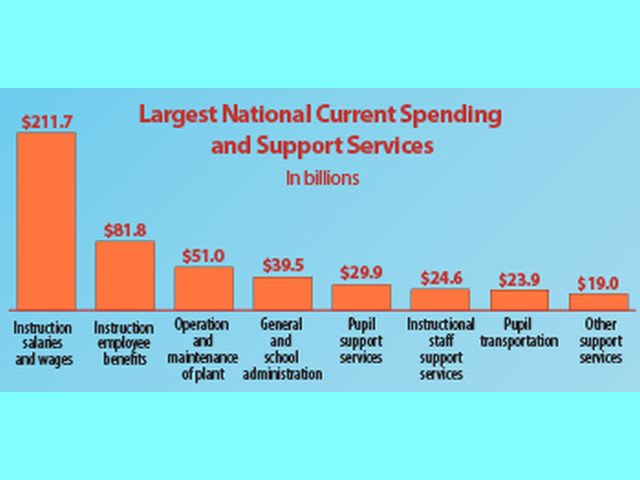
In 2014, pupil transportation spending amounted to $23.9 billion out of a total expenditure of $613.6 billion by public school systems nationwide. Source: U.S. Census Bureau

Elementary and secondary education revenue were up 3.3% nationally in fiscal year 2014, amounting to $617.6 billion, according to a report released on Thursday by the U.S. Census Bureau.
“This is the largest increase in total revenue since 2008, when there was a 4.1% increase from the prior year,” said Stephen Wheeler, an analyst at the Census Bureau. “School system revenue comes from federal, state, and local government sources.”
Per-pupil spending for the nation was $11,009, a 2.7% increase from 2013. This was the largest increase in per-pupil spending since 2008, when there was a 6.1% increase from the year prior. Among the 50 states and the District of Columbia, New York spent the highest per pupil, at $20,610, while Utah came in the lowest at $6,500.
Per-pupil spending includes gross school system expenditure for instruction, support services, and non-instructional functions, including direct expenditure for salaries, employee benefits, student transportation, building maintenance, purchased property, and other services and supplies.
Following New York, the highest spending per pupil in 2014 was in the District of Columbia at $18,485, Alaska at $18,416, New Jersey at $17,907, and Connecticut at $17,745.
After Utah, the states spending the least per pupil were Idaho at $6,621, Arizona at $7,528, Oklahoma at $7,829, and Mississippi at $8,263.
The findings come from the “Public Education Finances: 2014 report,” which provides figures on revenues, expenditures, debt, and assets (cash and security holdings) for the nation’s elementary and secondary public school systems. The report and tables, released annually, include detailed statistics on spending — such as instruction, student transportation, salaries, and employee benefits — at the national, state, and school district levels.
Total expenditure by public school systems was $613.6 billion in fiscal year 2014, up 2.6% from 2013. Public education expenditure categories include instructional spending, support services spending, capital outlay, and other current spending. Total school district debt increased by 0.5% from the prior year.
Pupil transportation, which falls under support services spending, amounted to $23.9 billion nationwide in 2014. That’s 3.9% of the total expenditure by public school systems.
For more information, go here.
More Management
Photo Highlights: Inside the 2026 Michigan Association for Pupil Transportation Conference
Snapshots from the 2026 MAPT conference, where Michigan's school transportation professionals gathered for training, technology updates, awards, networking, and more.
Read More →
Zonar Launches Reimagined Bus Suite Web Portal
Can one platform replace your transportation software stack? Zonar says its new Bus Suite unifies routing, dispatch, field trips, GPS, and parent communication.
Read More →
Indiana Association Announces 2026 Award Winners
See who earned top honors at the 2026 School Transportation Association of Indiana conference, recognizing excellence in school transportation statewide.
Read More →

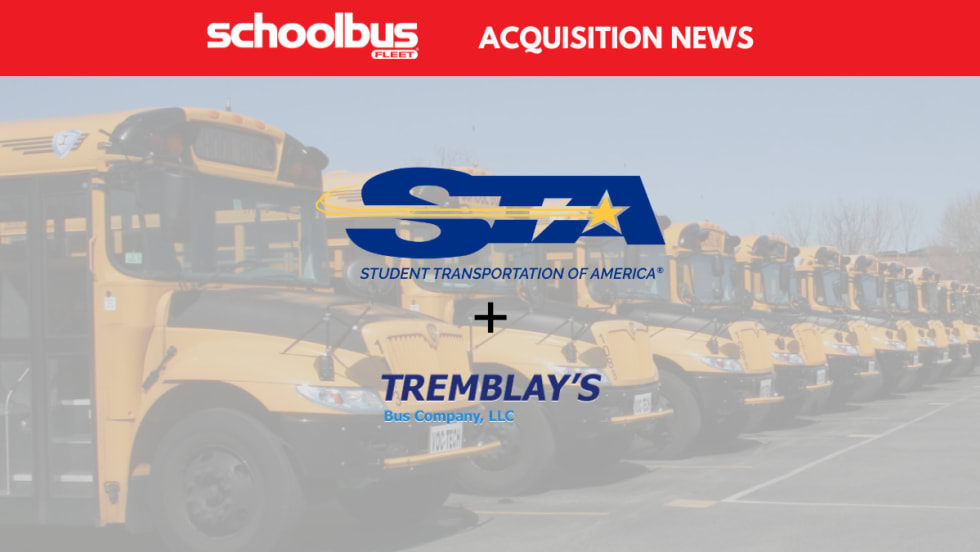
Student Transportation of America Acquires Massachusetts Contractor
Tremblay’s Bus Company and its 400-bus fleet joins the STA family of brands as the company grows its presence across the Northeast U.S.
Read More →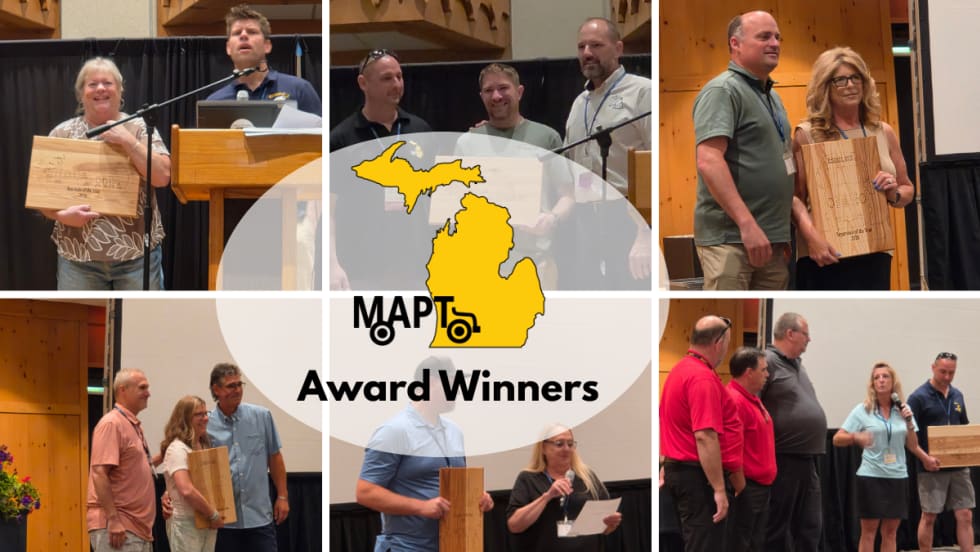
Michigan Association Announces 2026 Award Winners
See who earned top honors at the 2026 Michigan Association for Pupil Transportation conference, recognizing excellence in school transportation statewide.
Read More →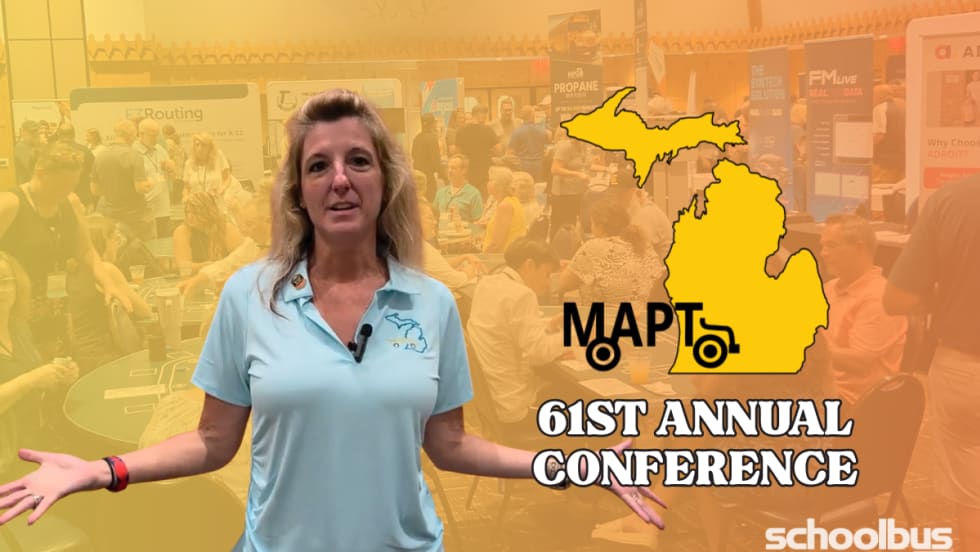
Inside MAPT 2026: Michigan’s School Transportation Community Connects at Boyne Mountain
Check out highlights from the 2026 MAPT Summer Conference, where over 300 transportation pros gathered for training, networking, awards, and trade show.
Read More →
Summit School Services to Complete Fleetwide Samsara Technology Rollout
The company said outfitting its entire fleet with AI-powered safety and fleet management technology will strengthen student safety and operational efficiency across its local brands.
Read More →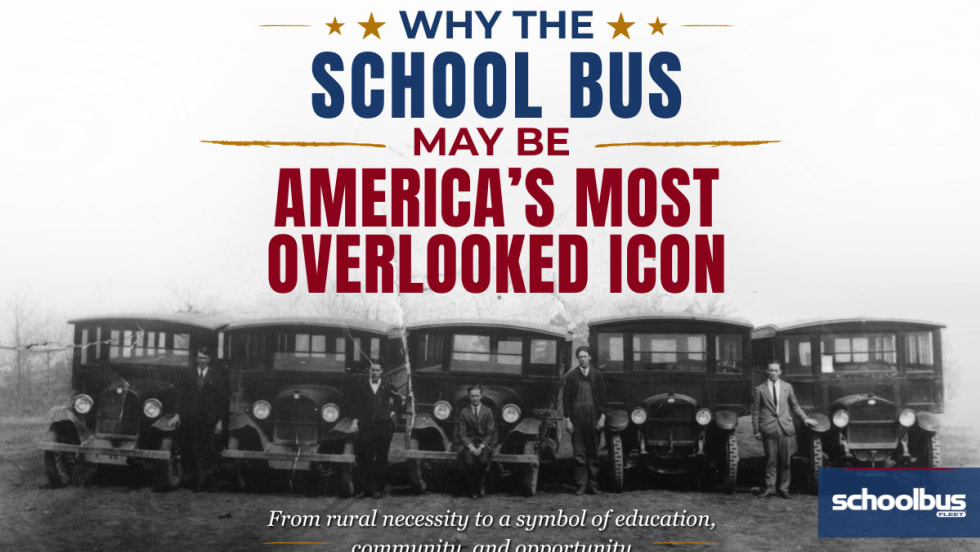
Why the School Bus May Be America's Most Overlooked Icon
Every day, millions of students climb aboard. But few realize the yellow school bus has helped transform education, connect communities, and come to symbolize civic responsibility.
Read More →
Why More Drivers Won’t Fix the Shortage
Hiring isn’t enough. Learn how leading fleets are solving driver shortages through smarter retention, training, and culture strategies.
Read More →
SBFX Keynote Announced: Ann Vote to Share Tips on Leadership and Team Culture
Find out who will be providing this year's keynote at SBFX in Scottsdale this September and what else to expect. District and contractor bus operators are invited to apply and attend at no cost!
Read More →