

NTSB Weighs in on Transportation Fatality Increase
The agency reports that a total of 39,339 people died in accidents in all modes of transportation in 2016, up from 37,309 in 2015.

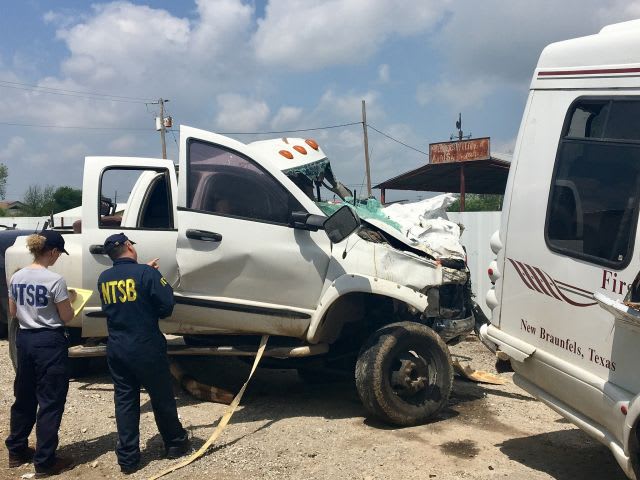
A total of 39,339 people died in accidents in all modes of transportation in 2016. Seen here is an NTSB crash investigation. NTSB photo by Jennifer Morrison
WASHINGTON, D.C. — Fatalities on the nation’s roads accounted for 95% of all transportation deaths in 2016, according to a new analysis by the National Transportation Safety Board (NTSB).
NTSB reported last week that a total of 39,339 people lost their lives in accidents in all modes of transportation — highway, rail, marine, aviation, and pipeline — in 2016. The total was an increase of 5.4% from the 37,309 transportation deaths in 2015.
As previously reported, data released recently by the National Highway Traffic Safety Administration (NHTSA) showed that there were 37,461 highway traffic fatalities in the U.S. in 2016, up 5.6% from the 2015 total of 35,485.
NTSB reported last week that fatalities also increased in the marine and rail transportation sectors. Marine deaths jumped from 688 in 2015 to 730 in 2016, while railroad deaths rose from 708 to 733.
Meanwhile, there was a slight decrease in aviation fatalities, from 416 to 412.
"Unfortunately, we continue to see increases in transportation fatalities," NTSB Chairman Robert Sumwalt said. "We can do more, we must do more, to eliminate the completely preventable accidents that claim so many lives each year. Implementation of the 315 open safety recommendations associated with the NTSB’s Most Wanted List of Transportation Safety Improvements has the greatest potential to reverse this alarming trend.”
Aviation statistics are tracked and compiled by the NTSB. The U.S. Department of Homeland Security provides marine statistics, and the U.S. Department of Transportation (which includes NHTSA) provides statistics for all other modes.
More Safety
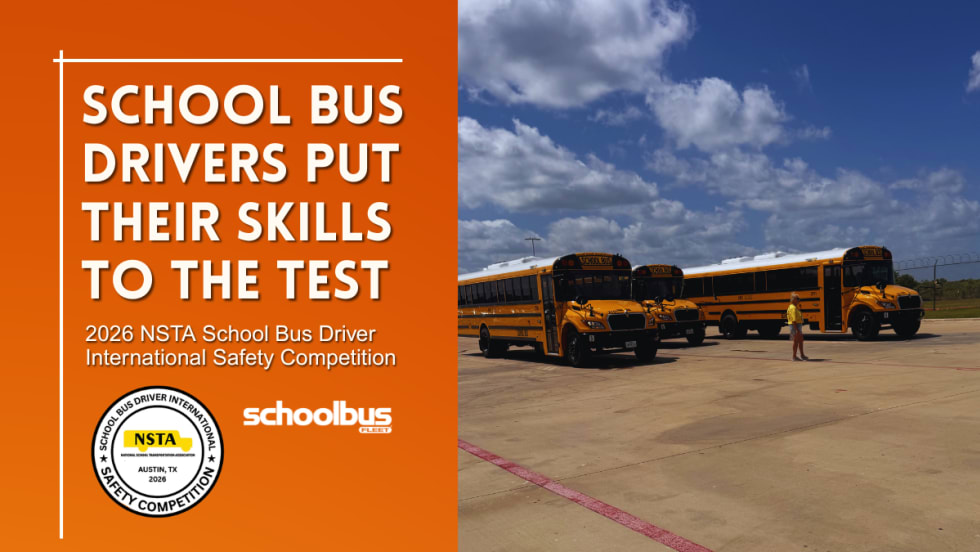
NSTA Announces 2026 School Bus Driver International Safety Competition Winners
Drivers from across the U.S. and Canada showcased their safety and driving skills, with two defending champions successfully retaining their titles.
Read More →
The Driver Shortage Playbook
Driver shortages are still a major challenge for student transportation fleets, but the real issue has shifted. It’s no longer just about filling seats quickly. It’s about finding safe, reliable drivers who meet performance expectations and want to stay. The Driver Shortage Playbook covers why traditional recruitment tactics are falling short and how school fleets are adapting with smarter hiring, stronger retention strategies and a greater focus on driver quality.
Read More →
Pro-Vision Launches AI-Powered 360° Camera System
The new Birdseye camera delivers real-time AI-based pedestrian and vehicle detections, full visibility around the bus, and telematics integrations.
Read More →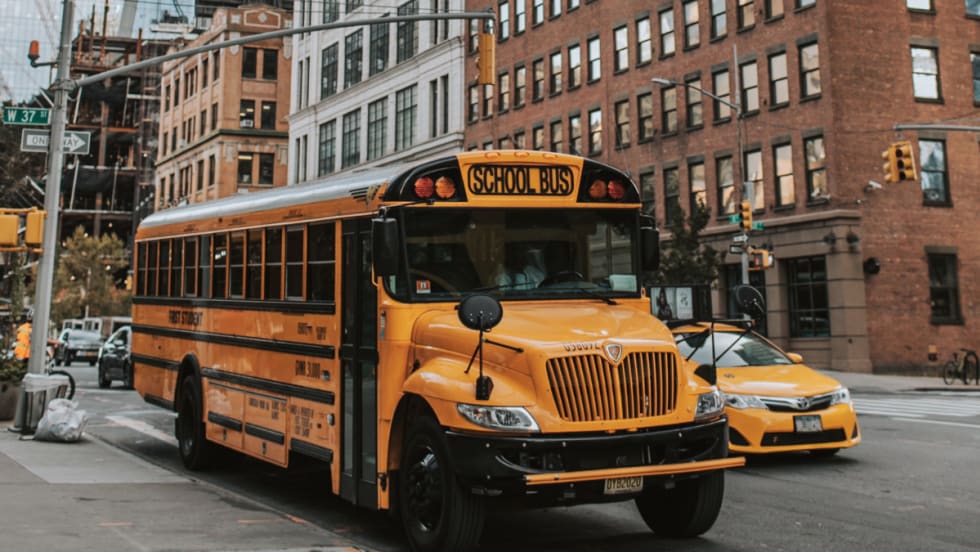
N.Y. & N.J. Coalitions Call for Modernized Transportation for Vulnerable Students
New statewide coalitions in New York and New Jersey are urging lawmakers to expand student transportation options for vulnerable students amid ongoing driver shortages.
Read More →
America Has a School Bus Passing Problem — and Distraction Is Making It Worse
Illegal school bus passing remains a major safety threat as distracted driving rises. This op-ed explores why awareness, enforcement, and stop-arm cameras matter more than ever.
Read More →
School Bus Laws to Watch: New York Delays EV Mandate
Plus, federal lawmakers seek new funding for school bus safety as states weigh stop-arm enforcement, disability protections, and education spending.
Read More →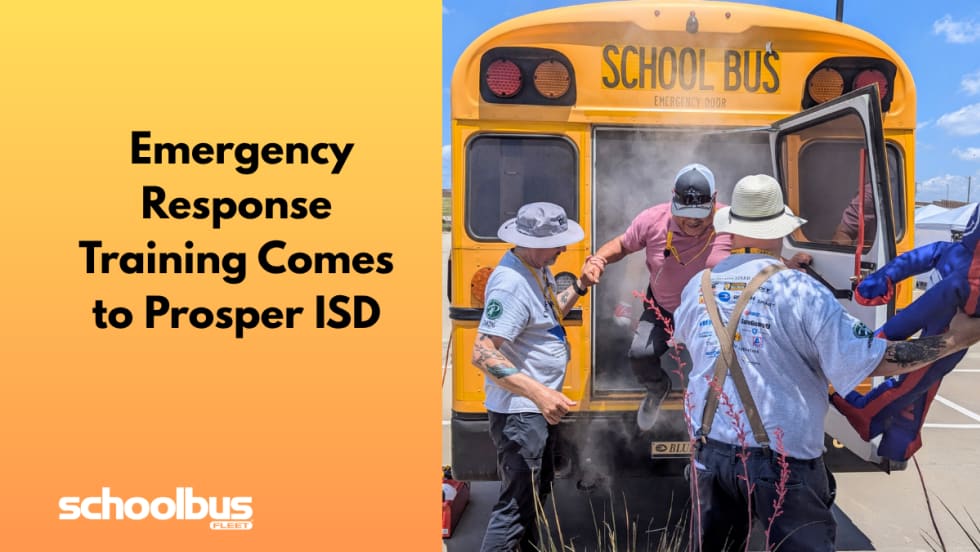
Operation STEER Brings Emergency Response Training to North Texas
Prosper ISD hosted the third annual training for transportation professionals across 67 districts to learn how to respond to emergencies, such as rollovers and evacuations, and proper use of safety equipment.
Read More →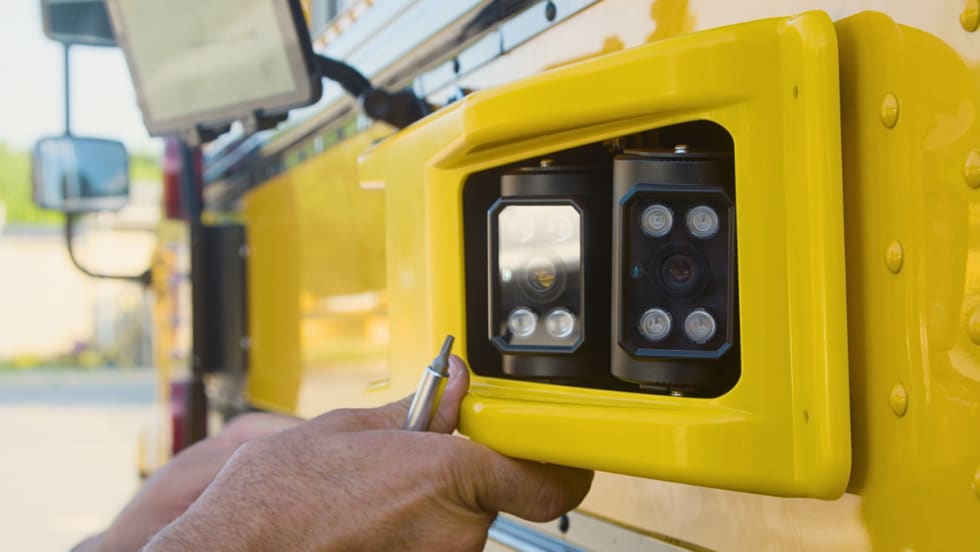
Florida District Relaunches BusPatrol School Bus Camera Program With New Safeguards
After being suspended over due process concerns, Miami-Dade schools and law enforcement are restarting the AI-powered stop-arm camera program with new oversight.
Read More →
School Bus Laws To Watch: Seat Belt Bills, Funding Fights & EV Changes
From national bills on seat belts and driver oversight to driver awareness campaigns referencing “Finn’s Rule” and ongoing transportation funding debates in Alaska, here’s the latest in school bus legislation across the U.S.
Read More →
9-Year-Old Boy Killed by School Bus at Busy Brooklyn Intersection
A Williamsburg community is mourning after a child was fatally struck by a private yeshiva bus, prompting calls for urgent safety improvements at the high-traffic crossing.
Read More →