




NTSB: Transportation fatalities dropped 2% in 2011
Preliminary data indicate that overall transportation fatalities in the U.S. decreased from 35,043 in 2010 to 34,434 in 2011. National Transportation Safety Board Chairman Deborah Hersman says that “we can do better” in reducing transportation accidents, which remain one of the nation’s leading causes of death.


Preliminary data show that there were 32,367 fatalities on U.S. roadways in 2011, about 94% of all transportation fatalities. (Note: Grade crossing fatalities are separated into the highway category and the rail category [not pictured] as appropriate.)
WASHINGTON, D.C. — Transportation fatalities in the U.S. decreased by about 2% in 2011, according to preliminary figures released on Thursday by the National Transportation Safety Board (NTSB).
The data indicate that overall transportation fatalities decreased from 35,043 in 2010 to 34,434 in 2011.
“Transportation accidents remain one of the nation’s leading causes of death,” NTSB Chairman Deborah Hersman said. “We can do better, which is why the NTSB shines a light on key safety issues each year through the Most Wanted List of transportation safety improvements.”
Here are some of the findings in the latest statistics:
• The number of fatalities on U.S. roadways decreased about 2%, from 32,999 in 2010 to 32,367 in 2011. The majority of these deaths involved passenger cars, light trucks and vans.
• The number of fatalities in buses (which was not broken down into type of bus) rose from 44 in 2010 to 54 in 2011. Bus fatalities accounted for about 0.2% of all highway fatalities in 2011.
• Grade crossing deaths dropped from 261 in 2010 to 251 in 2011.
• The total number of fatalities in aviation increased from 476 in 2010 to 494 in 2011, with about 90% involving fatalities in general aviation. There were no airline fatalities in 2011.
Aviation statistics are tracked and compiled by the NTSB. Marine statistics are provided by the U.S. Department of Homeland Security, and statistics for all other modes are provided by the U.S. Department of Transportation.
For more of the 2011 and 2010 U.S. transportation fatality data, click here.
Other news on transportation fatality statistics:
More Safety
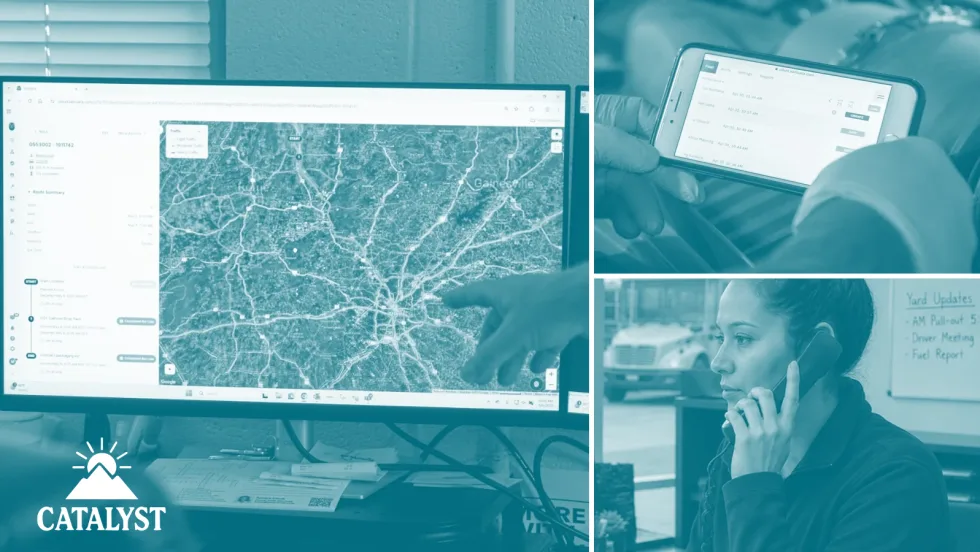
From Reactive to Proactive: Making Every Ride Visible
Smart technology only delivers its full value when it works together. See how Catalyst connects proven industry platforms to move student transportation from reactive to proactive.
Read More →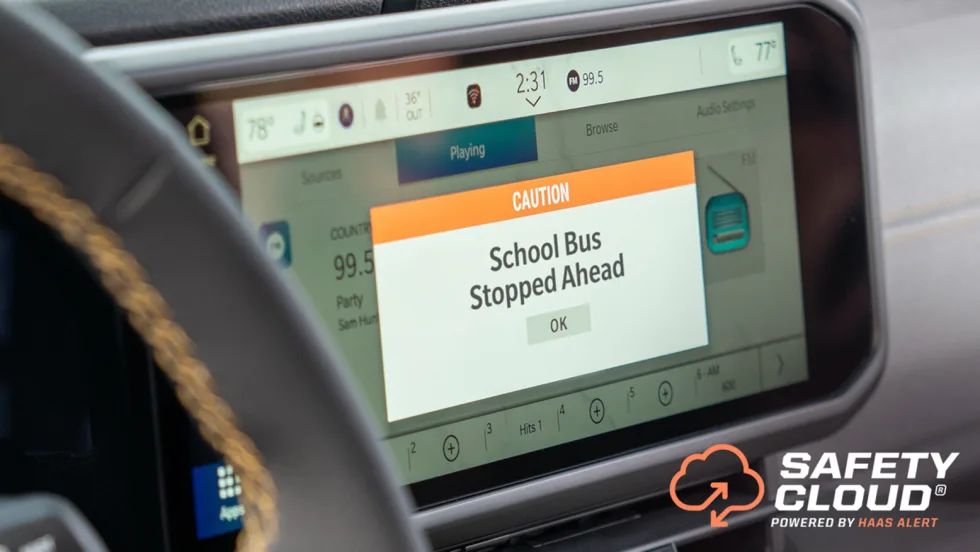
HAAS Alert’s Safety Cloud Warns Motorists of Stopped School Buses
Through a transponder or Samsara connection, the product lets school bus fleets send advance warnings to approaching drivers through in-vehicle alerts.
Read More →
HopSkipDrive Reports Progress on Safety Advisory Council
More than a year after forming the council, independent safety experts have helped shape new rider-safety features and policy progress, with a new goal to address rider behavior.
Read More →
What the 2026 National School Bus Safety Month Resolution Means for Student Transportation
The bipartisan resolution highlights illegal school bus passing, student safety during loading and unloading, and the need for driver training and public education.
Read More →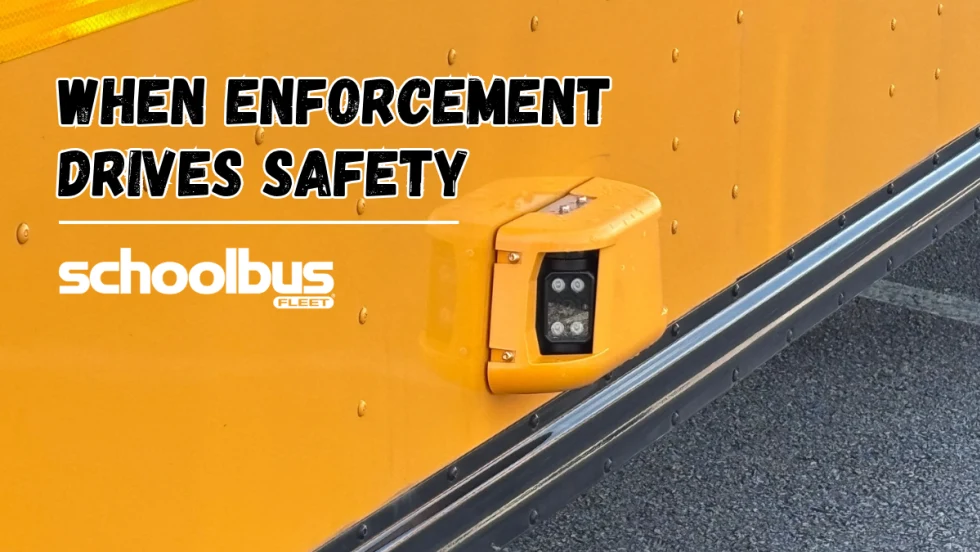
School Bus Stop-Arm Violations Decline 53% Across Verra Mobility Programs
Verra Mobility shares how school bus stop-arm cameras and school zone safety programs are changing driver behavior, reducing violations, and protecting students.
Read More →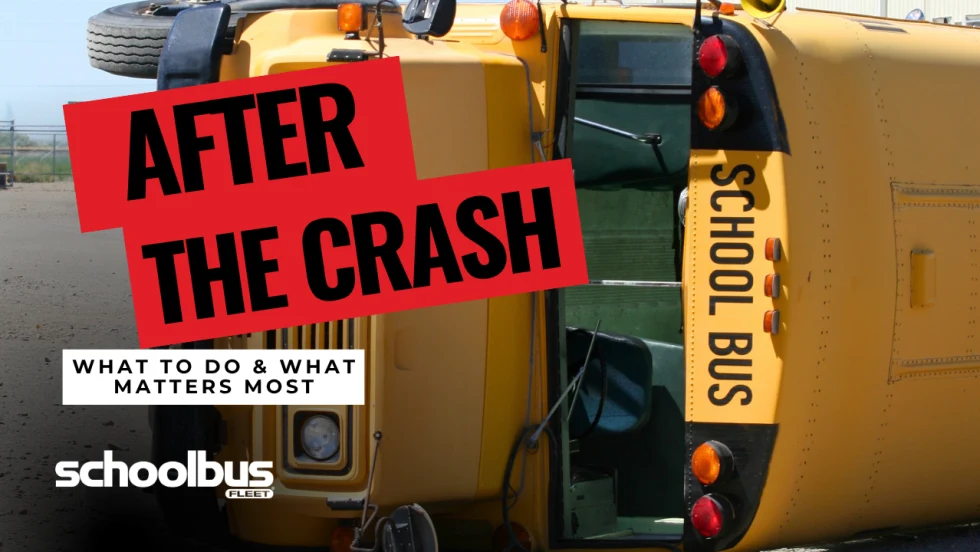
Most Bus Crashes Aren’t Your Fault. Here’s How to Prove It.
A guide for what to do in between a school bus crash and a claim: what to preserve, who to notify, and how to keep the facts available when they matter.
Read More →
National School Bus Safety Week 2026: Tips, Toolkits & Resources to Keep Students Safe
School bus safety takes more than awareness. Explore expert tips, enforcement strategies, and free resources to help protect students on every ride.
Read More →
2 Killed, Dozens Injured in Florida School Bus Crash
A multi-vehicle collision caused a Polk County school bus carrying 37 students to overturn on its way to Winter Haven High School.
Read More →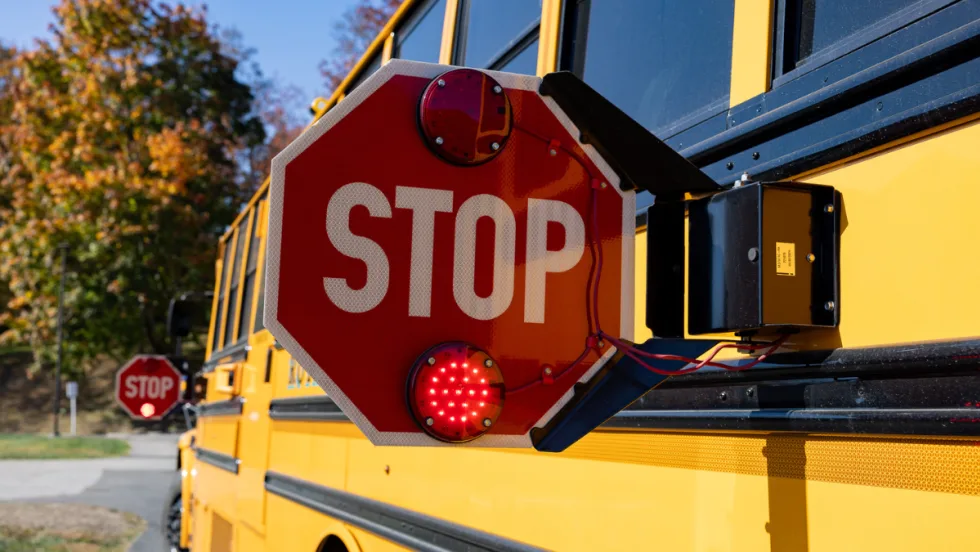
Illegal School Bus Passing Drops 24% in New York Districts
With fewer than 5% of citations involving repeat offenders, Westchester County officials said enforcement, education, and community partnerships are helping change driver behavior.
Read More →
School's Back. Here's What Happened to Traffic, Speeding & Distraction
What happens to traffic when school resumes? New data analysis examines changes in distracted driving, congestion, and speeding around schools.
Read More →