

Unlocking Hidden Value: Why Loss of Use Recovery Matters for School Bus Fleets
One of the most overlooked financial opportunities in school transportation is the bus’ downtime after a not-at-fault accident. Here’s how operators can reclaim thousands in recoverable downtime.
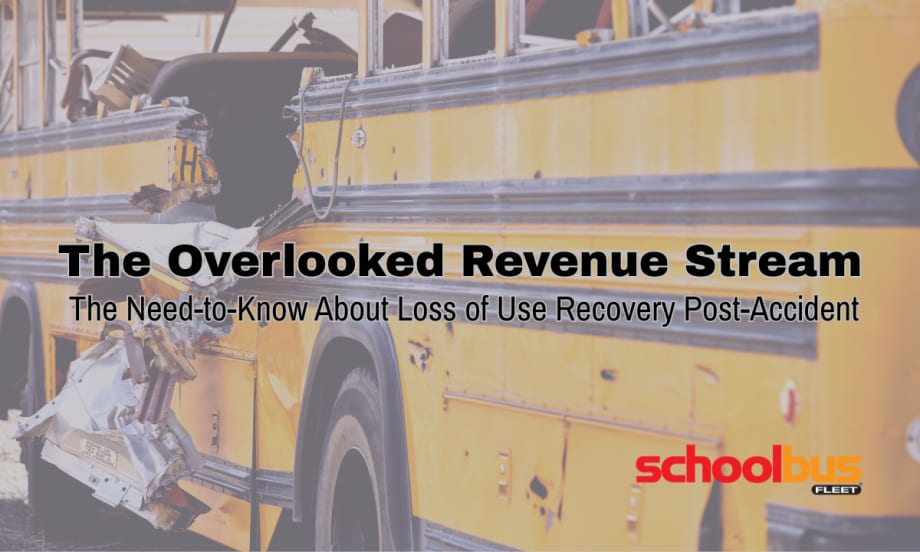
School bus downtime costs more than you think. Here’s what districts and contractors need to know about loss of use recovery.
Photo: School Bus Fleet
- School bus fleets often overlook the financial recovery available for downtime after accidents caused by others.
- Operators have the opportunity to reclaim substantial losses by addressing this recoverable downtime.
- Properly managing and recovering these losses can result in significant financial benefits for school transportation services.
*Summarized by AI
In the demanding world of school transportation, where safety, reliability, and efficiency are paramount, school bus operators face a myriad of challenges. From navigating tight budgets to ensuring uninterrupted service for students, every aspect of operations requires careful oversight. Yet, one area often overlooked is financial recovery following not-at-fault accidents — specifically, Loss of Use (LOU) damage recovery.
When a school bus is involved in a not-at-fault collision, the immediate focus is often on repairing and recovering physical damage to the school bus, known as Auto Physical Damage (APD). However, the downtime during repairs represents a significant, yet recoverable, loss that many fleets fail to claim.
After nearly two decades of analyzing LOU claims across various fleets, it's clear that opportunities for improvement are abundant, with physical damage recoveries still often showing 15% to 20% leakage and LOU efforts yielding only 20% to 30% of potential value — or none at all. Regardless of whether this is handled internally, by a TPA, or through a fleet management company, money is almost always left on the table.
Understanding Loss of Use: Beyond the Obvious Repair Costs
Loss of Use refers to compensation owed to a fleet owner for the period when a vehicle is unavailable due to repairs following a not-at-fault accident. No matter if there were spare vehicles and no service interruption, the law states that you are legally entitled to be compensated for your asset being off the road.
This compensation is distinct from APD, which covers the direct costs of fixing the bus, such as parts and labor. LOU compensates for the "use" value lost during downtime, calculated based on the daily rental equivalent of a similar vehicle and the number of days the vehicle was off the road based on the estimate of repairs (4 hours = 1 day of downtime).
For school buses, this calculation can be substantial: daily rates typically range from $600 to $1,500, depending on factors like location, bus size (e.g., Type A mini-buses versus full-size Type C or D models), location (urban vs. rural), and specialized features like wheelchair accessibility or electric propulsion.
Why does this matter? School bus operations are inherently time sensitive. Routes must run daily to transport students safely and on schedule. When a bus is sidelined, operators often rely on spare vehicles to maintain service continuity. However, the presence of spares does not negate the right to LOU recovery. Legally, in most U.S. jurisdictions, if another party caused the accident, their insurer is liable for both APD and LOU, regardless of whether operations continued uninterrupted. This principal stems from tort law, where the at-fault party must make the victim "whole" by covering all foreseeable losses.
Consider a typical scenario: A 72-passenger school bus in a mid-sized urban district is rear-ended by a negligent driver, requiring 10 days in the shop for frame repairs and painting. The APD might total $5,000, but the LOU, based on a $900 daily rental rate, could add another $9,000. Without pursuing LOU, the school bus fleet operator absorbs this cost indirectly through increased wear on spares, potential overtime for maintenance staff, or delayed fleet upgrades. Over time, these unclaimed amounts erode budgets that could otherwise fund critical initiatives like driver training, safety technology (e.g., GPS tracking or collision-avoidance systems), or transitioning to electric buses.
Industry statistics underscore the prevalence of accidents and their financial toll. Commercial fleets, including school buses, experience accidents at an annual rate of about 20%, with an average of 4.5 incidents per driver. In the school bus sector, where vehicles log millions of miles annually, even minor fender-benders can lead to extended downtime due to stringent safety inspections and parts shortages.
Rising costs exacerbate this: Bus parts and labor have increased by 10% to 20% in recent years, driven by supply chain disruptions and inflation. For electric buses, repair times can be longer due to specialized components, amplifying LOU potential.
The Hidden Impact of Bus Downtime: Real-World Implications
Downtime's ripple effects extend far beyond the garage. For a fleet operator, a sidelined bus disrupts route planning, increases fuel consumption from rerouting, and strains resources.
Financially, the impact is quantifiable. A single 10-day downtime event at $600-$1,300 per day translates to $6,000-$13,000 in LOU per bus. Scale this across a 50-bus fleet with five not-at-fault incidents annually, and the total could exceed $150,000 — funds that could offset rising operational costs like driver shortages (with wages up 15% in some regions) or insurance premiums.
Case studies from large student transportation providers highlight these realities. In one instance, a leading U.S. school bus operator serving students daily across full-service management, special-needs transport, fleet electrification, route optimization, and charter services had historically focused on APD recoveries through their TPA. However, an audit revealed they were leaving millions unclaimed in LOU. Given the common occurrence of commercial fleet accidents, the provider's TPA prioritized "low-hanging fruit" like straightforward APD claims, often overlooking LOU entirely. This oversight meant LOU, which can equal 1-2 times the APD in the school bus industry, went unpursued.
Upon conducting a no-cost audit of past claims within the statute of limitations (typically two to six years, varying by state), specialists identified undervalued or ignored LOU opportunities. A pilot program reviewing 20 accounts yielded immediate returns, leading to a full partnership. In the first year alone, $1.1 million in LOU was recovered, with total recoveries reaching $4.2 million from 2022 to 2024. Notably, 82% of placed accounts were successfully recovered, demonstrating how targeted expertise can turn denials into dollars. The audit uncovered that previous LOU calculations were based on estimates lacking state-specific methodologies, resulting in underpayments or outright rejections.
“If your fleet is not pursuing Loss of Use recovery, you are leaving money on the table.”
— Sam Fensterstock, Cadex Insurance Recovery
Another case involved a multifaceted transportation provider operating over 20,000 school buses serving 1.3 million students daily, alongside transit and shuttle services. Under pressure to improve profitability amid debt and investments in zero-emission vehicles, the company audited 10,000 closed claims over three years. This revealed over 1,000 viable LOU and 150 APD cases, including split-liability scenarios where partial fault (e.g., 20% to 30%) still warranted compensation. The TPA undercalculated LOU and ignored split-liability pursuits, leaving substantial funds untapped. Through meticulous review of repair receipts, police reports, and expert testimony, recoveries totaled $5 million since 2018, with $4.5 million in LOU (over 150% of APD) and $542,000 in additional APD. Ongoing annual recoveries now exceed $1 million, with an 82% success rate across claims.
These examples illustrate a common pattern: Even reputable TPAs and internal claims teams often undervalue LOU recovery due to resource constraints or focus on volume over depth. Also, what makes things even more difficult is that leading adverse insurers deny 70% to 80% of all LOU claims initially, citing reasons like "availability of spares," "insufficient documentation," or "no demonstrated loss." Yet, many denials are reversible with proper evidence, such as downtime logs, rental market data, and most importantly, legal precedents. In school bus fleets, where LOU can be 1-3 times APD, failing to challenge these denials could leave your company on the hook for significant costs.
Why LOU Matters More Than Ever: Financial and Operational Benefits
In today's economic climate, with school districts grappling with funding shortfalls and regulatory demands for sustainable fleets, LOU recovery offers a lifeline. For a modest 50-bus fleet with five eligible incidents per year could recoveries topping $50,000, providing flexibility for enhancements such as advanced telematics or driver retention programs. Larger operations amplify this: The providers recovered millions, offsetting electrification costs (new electric buses cost $250,000+ vs. $110,000 for diesel) and addressing driver shortages amid a 20% industry vacancy rate.
Moreover, LOU isn't just about cash; it's about equity. Fleets invest heavily in maintenance to ensure safety, so why absorb downtime costs caused by others? District fleets, often publicly funded, have a fiduciary duty to maximize recoveries, freeing resources for student-focused priorities.
From 20 years of LOU audits, patterns emerge: Physical damage (APD) processes leak 15% to 20% due to incomplete documentation or unchallenged underpayments. For LOU, the gap is wider — 20% to 30% recovery rates when pursued, but many fleets (internal or outsourced) ignore it entirely, viewing it as too complex. This "leakage" stems from inconsistent methodologies, such as using generic rental rates rather than market-specific ones or failing to address and contest initial denials.
Overcoming Denials and Complexity: Strategies for Success
Insurers employ tactics to minimize payouts, exploiting policy ambiguities or demanding exhaustive proof. Common denials include "no loss incurred" (if spares were used) or "inadequate evidence." Countering this requires robust documentation: Police reports establishing fault, repair estimates with timelines, downtime logs, and rental value substantiation from sources like local dealers or industry benchmarks.
Split-liability cases add a layer. Insurers may argue that partial fault precludes full recovery, but even 20% to 30% splits can yield value in high-damage incidents. In the multifaceted provider case, pursuing splits recovered funds that TPAs overlooked, avoiding litigation while securing settlements.
For fleets handling claims internally, resource limitations hinder deep pursuits. TPAs, while efficient for APD, often deprioritize LOU due to its nuance. Audits reveal 11% of "closed" cases warrant reopening, as seen in the student transportation provider's experience, where combined APD/LOU demands undervalued claims.
Best practices include:
- Documentation Protocols: Maintain detailed records from incident to resolution.
- State-Specific Knowledge: Tailor claims to local laws (e.g., California's generous statutes).
- Challenge Denials: 70% to 80% are unchallenged industry-wide; persistence yields 80%+ overturn rates.
- Audits and Pilots: Review past claims within limitations to identify leakage without upfront commitment.
Starting Small: Implementing LOU Recovery Effectively
Begin with a low-risk audit of recent claims, often revealing quick wins. In the case studies, pilots demonstrated ROI rapidly, leading to scaled programs. For fleets not pursuing LOU, start by educating teams on its legality and value. If already engaged, audit to plug leaks: Are recoveries at 20% to 30%? Is LOU 1-2x APD? If not, reassess processes.
Tools like specialized software for tracking or expert networks for valuations enhance outcomes. Whether rural or urban, small, or large, LOU empowers fleets to reclaim what is owed.
A Call to Action for Fleet Optimization
LOU recovery is a legally entitled, often overlooked avenue for financial stability in school bus operations. Case studies show millions recovered through audits and targeted pursuits, even in complex scenarios. If your fleet is not pursuing LOU, you are leaving money on the table. If you are, audit rigorously to ensure maximum value. With downtime costs rising, initiative-taking management is not optional; it's essential for sustaining safe, efficient service.
Sam Fenterstock
About the Author: Sam Fensterstock is the senior vice president of business development for Cadex Insurance Recovery (formerly TranSubro and Insurance Recovery Group), a subrogation outsourcing firm with a specialized focus on Loss of Use Damage Recovery. For close to 20 years, Cadex Insurance Recovery has been consulting with and working alongside leading fleets, school bus contractors, and school districts, helping them maximize their recoveries from not-at-fault accidents and getting every dollar they are owed from leading insurance carriers. Fensterstock can be reached at samf@cadex-solutions.com or 704-830-8730.
This article was authored and edited according to School Bus Fleet editorial standards and style. Opinions expressed do not necessarily reflect that of SBF or Bobit Business Media.
Quick Answers
Loss of use recovery refers to the compensation operators can claim for the downtime experienced by a school bus after a not-at-fault accident. This recovery accounts for the financial impact of the bus being out of service.
*Summarized by AI
More Management

Changing Lanes: AMF Bruns, Pro-Vision, CALSTART, HopSkipDrive, & Kooner
Check out who's been hired, promoted, and appointed to leadership positions at various school transportation industry suppliers and nonprofits.
Read More →
NCST Announces 18th Congress Event Dates, New Committees
The National Congress on School Transportation moves to St. Louis in May 2029, convening delegates and industry representatives to discuss new best practice recommendations. Now, the new committee chairs have been named.
Read More →
Key Moments from the 2026 NSTA Annual Meeting in the Mile High City
From federal policy updates and OEM presentations to speed networking and industry awards, see photos and highlights from the contractor association’s summer conference in Denver.
Read More →
HopSkipDrive Launches Spanish-Language App Update, Plans Additional Language Support
The update aims to improve communication with multilingual families by offering ride tracking, notifications, and support in Spanish, with more languages planned for the 2026-2027 school year.
Read More →
Where the Yellow Bus Takes Us: School Bus Fleet's 2026 Photo of the Year Winners
See the winning photos from School Bus Fleet's 2026 Photo of the Year contest, featuring stunning school bus images from across the U.S., from scenic landscapes to everyday moments.
Read More →
Why Emotional Intelligence Matters in Student Transportation
Learn the five key elements that bus drivers and transportation directors can use to stay calm in any situation.
Read More →
2026 Back-To-School Readiness Report
Staffing gaps, flat budgets, and the distance between “mostly prepared” and ready for the 2026-2027 school year.
Read More →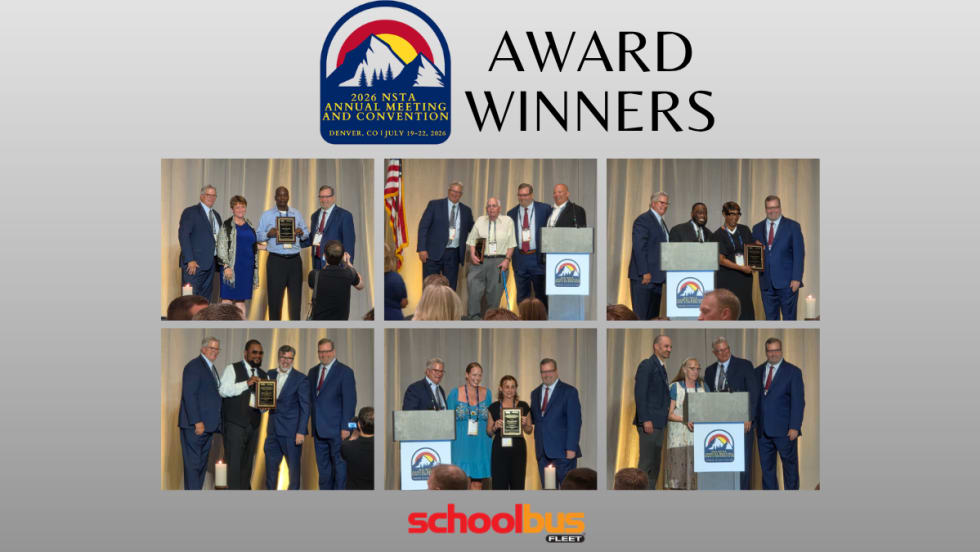
National School Transportation Association Presents 2026 Award Winners
Twenty-one individuals and contractor companies were recognized for excellence in student transportation at NSTA's annual meeting and convention in Denver.
Read More →
School Transportation Data Is Only as Powerful as the Story It Tells
Leaders say turning operational metrics into student-centered narratives can help districts justify investments and improve service.
Read More →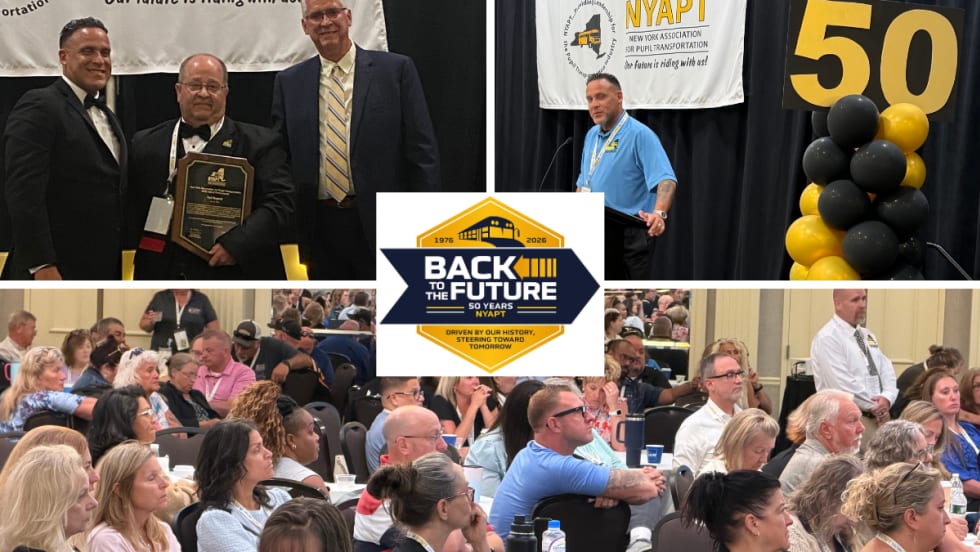
Photos: NYAPT Celebrates 50 Years at 2026 Conference & Trade Show
See highlights from NYAPT's 50th anniversary conference in Saratoga Springs, featuring educational sessions, awards, a trade show, networking, and more.
Read More →