




Don't miss the full 2026 survey results detailing district operating trends! Read: 6 School Transportation Trends to Watch: 2026 District Survey Results.
The 100 Largest School Bus Fleets in America: 2026 Rankings
Which public K-12 school districts are the largest in the nation in terms of bus fleet size? Here are the new standings of the top 100 district fleets.
October 28, 2026
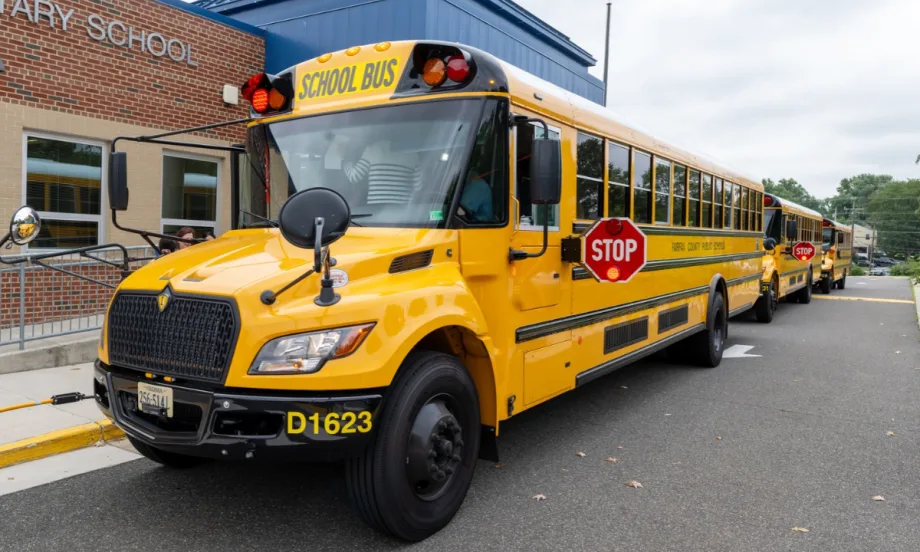
Fairfax County Public Schools in Virginia ranks No. 6 on this year's list.
Credit:
Donnie Biggs/Fairfax County Public Schools
6 min to read
Which are the largest school district fleets across North America? Based on School Bus Fleet's annual K-12 district survey, Georgia’s Gwinnett County remains the verified leader (we were unable to verify NYC's fleet, but according to public reports, it runs the most buses).
This annual ranking highlights the largest public K-12 school district-operated fleets in the U.S. based on the number of buses, students transported, and miles driven. Together, these operations transport millions of students daily in an ever-challenging industry.
Top 100 School District Fleets of 2026
Rank | School District | Total Number of Buses | Buses Used on Daily Routes | Contractor Buses | Students Transported Daily | Annual Route Mileage |
|---|---|---|---|---|---|---|
1 | New York City Public Schools (N.Y.)** | 10,500 | 150,000 | |||
2 | Gwinnett County Public Schools (Ga.) | 2,012 | 1,600 | 0 | 134,000 | 25,000,000 |
3 | Clark County School District (Nev.) | 1,900 | 1,600 | 0 | 117,000 | 23,375,000 |
4 | Los Angeles Unified School District (Calif.) | 1,800 | 1,350 | 500 | 13,000 | 12,000,000 |
5 | Oakland Schools (Mich.) | 1,790 | 1,587 | 388 | 102,000 | 12,699,333 |
6 | Fairfax County Public Schools (Va.) | 1,625 | 1,187 | 0 | 131,000 | 16,877,288 |
7 | Montgomery County Public Schools (Md.) | 1,455 | 1,220 | 286 | 98,000 | 20,000,000 |
8 | Prince George's County Schools (Md.)* | 1,267 | 1,051 | 0 | 87,000 | 16,638,034 |
9 | Broward County Public Schools (Fla.) | 1,178 | 900 | 0 | 54,074 | 10,700,000 |
10 | School District of Philadelphia (Pa.) | 1,164 | 808 | 877 | 16,215 | 8,265,503 |
11 | Hillsborough County Public Schools (Fla.) | 1,100 | 750 | 0 | 72,000 | 13,000,000 |
12 | DeKalb County School District (Ga.) | 1,040 | 700 | 0 | 45,000 | 17,890,000 |
13 | Miami-Dade County Public Schools (Fla.)* | 1,015 | 665 | 65 | 44,000 | 12,000,000 |
14 | Cobb County School District (Ga.) | 1,001 | 810 | 0 | 60,683 | 10,006,740 |
15 | Northside ISD (Texas) | 985 | 410 | 0 | 28,456 | 6,082,290 |
16 | Newark Public School District (N.J.) | 980 | 965 | 952 | 6,000 | |
17 | The School District of Lee County (Fla.)** | 974 | 641 | 48,085 | 8,763,950 | |
18 | Dallas ISD (Texas)** | 971 | 782 | 20,000 | 11,400,000 | |
19 | Chicago Public Schools (Ill.) | 960 | 890 | 960 | 14,741 | 6,994,559* |
20 | Cypress-Fairbanks ISD (Texas) | 954 | 694 | 0 | 63,931 | 9,100,000 |
21 | Baltimore County Schools (Md.) | 954 | 713 | 208 | 74,058* | 17,422,373* |
22 | Jefferson County Public Schools (Ky.) | 934 | 641 | 0 | 48,954 | 11,100,000 |
23 | Fulton County School District (Ga.) | 931 | 637 | 0 | 45,321 | 9,400,000 |
24 | Duval County Public Schools (Fla.)** | 860 | 710 | 33,539 | 8,317,066 | |
25 | Charlotte-Mecklenburg Schools (N.C.) | 825 | 750 | 0 | 72,952 | 17,611,500 |
26 | Anne Arundel County Public Schools (Md.) | 815 | 632 | 578 | 59,200 | 10,000,000 |
27 | Wake County Public School System (N.C.) | 800 | 570 | 0 | 89,000 | 20,000,000 |
28 | Prince William County Public Schools (Va.)** | 800 | 60,000 | 10,000,000 | ||
29 | The School District of Palm Beach County (Fla.)* | 789 | 530 | 30 | 60,510 | 9,584,000 |
30 | Hawaii Department of Education | 786 | 572 | 736 | 22,651 | 4,049,000 |
31 | Orange County Public Schools (Fla.) | 775 | 527 | 0 | 52,300 | 12,079,972 |
32 | Columbus City Schools (Ohio) | 755 | 493 | 68 | 32,335 | 7,581,060 |
33 | Loudoun County Public Schools (Va.) | 750 | 532 | 0 | 60,000 | 8,000,000 |
34 | Boston Public Schools (Ma.) | 750 | 610 | 750 | 19,000 | 4,000,000 |
35 | Houston ISD (Texas) | 711 | 479 | 0 | 9,144 | 6,750,000 |
36 | Virginia Beach City Public Schools (Va.) | 709 | 527 | 0 | 46,246 | 8,300,000 |
37 | Katy ISD (Texas)** | 707 | 25,000 | |||
38 | Mobile County Public Schools (Ala.) | 695 | 654 | 0 | 20,144 | 41,000 |
39 | Conroe ISD (Texas) | 617 | 368 | 0 | 39,000 | 7,000,000 |
40 | Chesterfield County Public Schools (Va.) | 614 | 479 | 0 | 45,000 | 8,700,000 |
41 | Henrico County Schools (Va.) | 605 | 500 | 0 | 30,000 | 6,200,000 |
42 | District of Columbia Public Schools** | 603 | 3,498 | |||
43 | Metro Nashville Public Schools (Tenn.) | 602 | 369 | 0 | 41,574 | 7,239,473 |
44 | Yonkers Public Schools (N.Y.) | 560 | 560 | 11,867 | 3,418,651 | |
45 | Greenville County Schools (S.C.) | 557 | 450 | 0 | 32,000 | 6,840,000 |
46 | Austin ISD (Texas) | 550 | 300 | 0 | 20,000 | 3,600,000 |
47 | East Baton Rouge Parish School (La.) | 550 | 380 | 4 | 28,000 | 3,000,000 |
48 | Charleston County School District (S.C.) | 548 | 480 | 480 | 22,000 | 5,700,000 |
49 | Harford County Public Schools (Md.)** | 530 | 408 | 32,000 | 7,600,000 | |
50 | Jefferson County Board of Education (Ala.) | 525 | 451 | 0 | 16,199 | 2,266,740 |
51 | Forsyth County Schools (Ga.) | 518 | 451 | 0 | 32,000 | 311,400 |
52 | Chesapeake Public Schools (Va.) | 513 | 381 | 0 | 27,000 | 4,711,552 |
53 | Polk County Public Schools (Fla.)** | 511 | 50,000 | 10,920,000 | ||
54 | Fort Bend ISD (Texas) | 500 | 450 | 100 | 26,000 | 5,000,000 |
55 | Omaha Public Schools (Neb.) | 495 | 389 | 239 | 14,000 | 5,174,877 |
56 | San Diego Unified School District (Calif.)* | 479 | 280 | 0 | 4,588 | 1,873,476 |
57 | Frederick County Public Schools (Md.) | 477 | 362 | 0 | 31,000 | 7,869,281 |
58 | Horry County Schools (S.C.) | 475 | 395 | 0 | 39,000 | 6,100,000 |
59 | Aldine ISD (Texas)** | 474 | 330 | 32,000 | 4,916,221 | |
60 | Cherokee County School District (Ga.) | 471 | 380 | 0 | 29,000 | 5,160,000 |
61 | Knox County Schools (Tenn.) | 465 | 357 | 357 | 20,000 | 3,000,000 |
62 | Pinellas County Schools (Fla.) | 450 | 305 | 0 | 21,000 | 6,500,000 |
63 | Cincinnati Public Schools (Ohio) | 428 | 284 | 11,055 | 20,856,935 | |
64 | Baldwin County Schools (Ala.) | 425 | 340 | 0 | 17,000 | 4,000,000 |
65 | Cumberland County Schools (N.C.) | 424 | 384 | 4 | 30,198 | 25,390 |
66 | St. Tammany Parish Public School System (La.)* | 415 | 384 | 215 | 21,000 | 5,000,000 |
67 | Pasco County School District (Fla.) | 411 | 292 | 0 | 33,554 | 37,199 |
68 | St. Lucie Public Schools (Fla.) | 408 | 282 | 0 | 23,542 | 6,556,854 |
69 | Hall County School District (Ga.) | 400 | 293 | 0 | 20,000 | |
70 | Spotsylvania County Public Schools (Va.)** | 400 | 24,000 | |||
71 | Albuquerque Public Schools (N.M.) | 380 | 270 | 30 | 28,701 | 4,869,774 |
72 | Atlanta Public Schools (Ga.) | 377 | 296 | 0 | 15,000 | 3,671,924 |
73 | Jefferson Parish School (La.) | 371 | 338 | 156 | 45,190 | |
74 | Osceola County School District (Fla.) | 369 | 249 | 0 | 26,446 | 4,030,794 |
75 | Portland Public Schools (Maine)* | 368 | 319 | 248 | 10,823 | 3,476,207 |
76 | Marion County Public Schools (Fla.)** | 367 | 261 | 19,260 | 6,093,000 | |
77 | Alpine School District (Utah) | 361 | 223 | 0 | 30,000 | 11,976,000 |
78 | Garland ISD (Texas) | 360 | 275 | 0 | 10,000 | 4,995,000 |
79 | Leander ISD (Texas) | 360 | 152 | 0 | 13,000 | 3,000,000 |
80 | Klein ISD (Texas) | 358 | 245 | 0 | 21,478 | 2,900,000 |
81 | Washoe County School District (Nev.) | 353 | 275 | 0 | 20,000 | 5,084,000 |
82 | Collier County Public Schools (Fla.)** | 350 | 325 | 0 | 18,000 | 5,200,000 |
83 | Escambia County Public Schools (Fla.) | 350 | 211 | 0 | 24,000 | 5,829,750 |
84 | Anoka-Hennepin Schools (Minn.) | 344 | 304 | 304 | 29,500 | 6,500,000 |
85 | School District U-46, Elgin (Ill.) | 342 | 246 | 0 | 23,000 | 4,000,000 |
86 | Brevard Public Schools (Fla.) | 342 | 248 | 0 | 14,874 | 4,375,894 |
87 | Memphis-Shelby County School District (Tenn.) | 339 | 339 | 23,000 | 54,728 | |
88 | Stafford County Public Schools (Va.) | 339 | 240 | 0 | 26,000 | 3,763,179 |
89 | Special School District (Mo.) | 332 | 245 | 125 | 4,300 | 4,495,733 |
90 | Henry County Schools (Ga.) | 325 | 279 | 0 | 22,000 | 5,022,980 |
91 | Detroit Public Schools (Mich.) | 322 | 292 | 322 | 12,250 | 3,205,010 |
92 | Cherry Creek Schools (Colo.) | 320 | 252 | 0 | 24,000 | 2,600,000 |
93 | Plano ISD (Texas) | 311 | 265 | 0 | 10,000 | 2,500,000 |
94 | Beaverton School District (Ore.) | 310 | 235 | 0 | 23,000 | 3,000,000 |
95 | Indianapolis Public Schools (Ind.)* | 306 | 249 | 306 | 15,000 | 4,000,000 |
96 | Seminole County Public Schools (Fla.) | 305 | 237 | 0 | 30,000 | 6,500,000 |
97 | Lamar Consolidated ISD (Texas) | 300 | 278 | 0 | 24,500 | 2,600,000 |
98 | Portland Public Schools (Ore.)** | 300 | 49,000 | |||
99 | Tucson Unified School District (Ariz.)** | 300 | 20,000 | 4,300,000 | ||
100 | Lake County Schools (Fla.) | 300 | 230 | 0 | 18,400 | 5,290,000 |
Of responding districts | * latest available data | ** from publicly available reports
Did we miss you on this list? Please email info@schoolbusfleet.com with your district’s name, number of route buses, and contact info, and we’ll send you the survey when we’re compiling the next Top Districts list next year. If you have 300 or more school buses in route service (including those operated by contractors), you should be in the running.
Subscribe to Our Newsletter
More Management

EverDriven Launches Route Consolidation Calculator to Estimate Diesel Savings
As diesel prices hit record highs, the largest alternative transportation provider says a 10% route consolidation could save a 120-route district more than $78,000 a year in fuel alone.
Read More →
Zum Secures Continued Financing Support for School Bus Expansion
Generate Private Credit has financed approximately $75 million in school bus deployments across three states, supporting more than 500 buses as Zum expands across the county.
Read More →
Beyond Discipline: A Different Approach to Student Behavior on the Bus
After implementing a dean of students program in Oregon, North Clackamas is seeing positive improvements. Here’s how it worked. The Route is brought to you by IC Bus.
Read More →
A Dean of Transportation's Different Approach to Student Behavior on the School Bus
After implementing a dean of students program in Oregon, North Clackamas is seeing positive improvements on the bus. Here’s how it worked.
Read More →
Inside NAPT ACTS 2026: Highlights from Louisville
From federal updates and student behavior strategies to new school bus technology and industry awards, see highlights from NAPT ACTS 2026 in Louisville.
Read More →
Meet the 2025 School Bus Driver Hero Winner: Annette Brown
We caught up with Wa-Nee Community Schools' Annette Brown on site at SBFX, where she was named the 2026 School Bus Driver Hero Award winner. Hear about her reaction, what she loves most about being a school bus driver, and more!
Read More →
Predictability Is Like Ketchup (According to 6-Year-Olds)
To students, a different school bus can feel like a full-blown crisis. One driver reflects on why familiar routines, showing up on time, and being reliably boring matter more than we think.
Read More →
Samsara Launches Free Driver Rewards Program
The new Driver Perks program gives eligible professional drivers access to discounts and offers without adding a cost for participating fleets.
Read More →
How Tax-Exempt Municipal Leases Can Help Finance School Buses
Let’s explore school bus financing options, including municipal leases, vendor payable accounts, and balloon payments, and how they can help stretch fleet budgets.
Read More →
Nominate Rising School Transportation Pros Under 40!
We’re searching for the next generation of leaders making an impact across the K-12 student transportation industry to recognize as SBF’s 2027 Trailblazers. Nominations are open now!
Read More →