


Don't miss the full 2025 survey results detailing district operating trends, our companion article to this post! Read Cleaner Fuels, Higher Wages, and More Tech: 2025 School District Survey.
The Largest School Bus Fleets in America: 2025 Rankings
Which public K-12 school districts are the largest in the nation by bus fleet size? Spoiler: Georgia's Gwinnett County topped the list for the fifth year in a row.
October 27, 2025
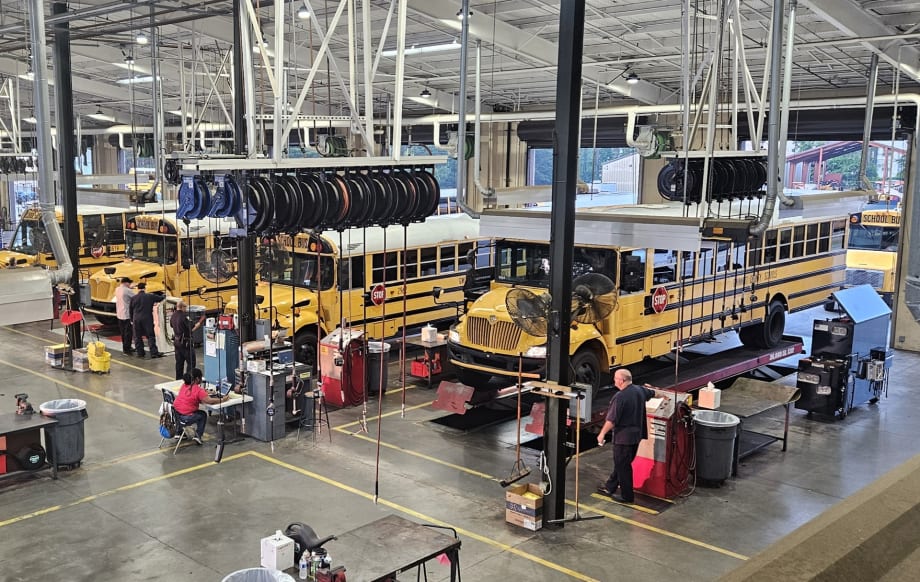
For the fifth consecutive year, Georgia’s Gwinnett County Public Schools continues to operate the nation’s largest school district fleet.
Photo: Gwinnett County (Ga.) Schools
4 min to read
- Georgia's Gwinnett County leads as the largest school bus fleet in the United States.
- The rankings highlight public K-12 school districts by bus fleet size nationwide.
- Gwinnett County has maintained the top position for five consecutive years.
*Summarized by AI
Looking at the list of the largest school districts this year, based on School Bus Fleet's annual district survey, Georgia’s Gwinnett County remains the leader in fleet size and number of students bussed, overtaken only by Las Vegas’ Clark County in total distance traveled. Georgia’s Cobb County dropped in the rankings this year, nudged out by other East Coast and Southern schools.
This annual ranking highlights the largest public K-12 school district-operated fleets in the U.S. based on the number of buses, students transported, and miles driven. Together, these local operations represent millions of daily student trips and a cross-section of the nation’s most complex pupil transportation networks.
Top 5 School Districts Based on Ridership
Rank | School District | Students Transported Daily |
|---|---|---|
1 | Gwinnett County Public Schools (Ga.) | 135,000 |
2 | Fairfax County Public Schools (Va.) | 130,000 |
3 | Clark County School District (Nev.) | 125,000 |
4 | Montgomery County Public Schools (Md.) | 103,000 |
5 | Prince George's County Schools (Md.) | 87,000 |
*based on districts that participated in the survey
Top 5 School Districts Based on Route Miles Driven
Rank | School District | Annual Route Mileage |
|---|---|---|
1 | Clark County School District (Nev.) | 31,000,000 |
2 | Gwinnett County Public Schools (Ga.) | 24,635,000 |
3 | Montgomery County Public Schools (Md.) | 22,000,000 |
4 | DeKalb County School District (Ga.) | 18,000,000 |
5 | Baltimore County Schools (Md.) | 17,422,373 |
*based on districts that participated in the survey
Top 50 School District Fleets of 2025 - Overall
Rank | School District | Number of Buses | Buses Used on Daily Routes | Contractor Buses | Students Transported | Annual Route Mileage |
|---|---|---|---|---|---|---|
1 | Gwinnett County Public Schools (Ga.) | 2,006 | 1,600 | 0 | 135,000 | 24,635,000 |
2 | Clark County School District (Nev.) | 1,900 | 1,500 | 0 | 125,000 | 31,000,000 |
3 | Los Angeles Unified School District (Calif.) | 1,815 | 1,410 | 515 | 17,000 | 11,100,000 |
4 | Fairfax County Public Schools (Va.) | 1,625 | 1,147 | 0 | 130,000 | 16,000,000 |
5 | Montgomery County Public Schools (Md.) | 1,529 | 1,202 | 0 | 103,000 | 22,000,000 |
6 | Prince George's County Schools (Md.) | 1,267 | 1,051 | 0 | 87,000 | 16,638,034 |
7 | Hillsborough County Public Schools (Fla.) | 1,249 | 750 | 0 | 80,000 | 13,489,938 |
8 | Cypress-Fairbanks ISD (Texas) | 1,027 | 682 | 0 | 68,000 | 47,500 |
9 | DeKalb County School District (Ga.) | 1,024 | 750 | 0 | 55,000 | 18,000,000 |
10 | Miami-Dade County Public Schools (Fla.) | 1,007 | 696 | 60 | 42,048 | 10,500,000 |
11 | Cobb County School District (Ga.) | 983 | 859 | 0 | 64,937 | 10,986,305 |
12 | Baltimore County Schools (Md.) | 933 | 733 | 152 | 74,058 | 17,422,373 |
13 | Fulton County Schools (Ga.) | 926 | 678 | 0 | 43,153 | 9,800,000 |
14 | Orange County Public Schools (Fla.) | 910 | 527 | 0 | 52,000 | 13,056,403 |
15 | Wake County Public School System (N.C.) | 902 | 557 | 0 | 62,300 | 12,400,000 |
16 | Chicago Public Schools (Ill.) | 901 | 857 | 857 | 17,000 | 6,994,559 |
17 | Charlotte-Mecklenburg Schools (N.C.) | 836 | 836 |
| 78,000 | 17,346,000 |
18 | The School District of Palm Beach County (Fla.) | 789 | 530 | 30 | 60,510 | 9,584,000 |
19 | Loudoun County Public Schools (Va.) | 750 | 532 | 0 | 60,000 | 8,000,000 |
20 | Mobile County Public Schools (Ala.) | 728 | 539 | 0 | 24,200 | 10,660,000 |
21 | Columbus City Schools (Ohio) | 707 | 494 | 120 | 28,137 | 8,190,000 |
22 | Hawaii Department of Education | 691 | 547 | 651 | 23,150 | 4,050,000 |
23 | Chesterfield County Public Schools (Va.) | 650 | 510 | 0 | 40,000 | 5,500,000 |
24 | Henrico County Schools (Va.) | 600 | 454 | 0 | 31,000 | 11,000,000 |
25 | Metro Nashville Public Schools (Tenn.) | 600 | 400 | 0 | 40,000 | 5,728,000 |
26 | Austin ISD (Texas) | 550 | 300 | 0 | 22,000 | 3,600,000 |
27 | Greenville County Schools (S.C.) | 500 | 400 | 0 | 32,000 | 7,000,000 |
28 | Omaha Public Schools (Neb.) | 495 | 384 | 235 | 14,000 | 4,414,937 |
29 | San Diego Unified School District (Calif.) | 479 | 280 | 0 | 4,588 | 1,873,476 |
30 | Cherokee County School District (Ga.) | 472 | 386 | 0 | 28,000 | 6,200,000 |
31 | Baldwin County Schools (Ala.) | 430 | 330 | 0 | 16,000 | 3,822,000 |
32 | St. Tammany Parish Public School System (La.) | 415 | 384 | 215 | 21,000 | 5,000,000 |
33 | St. Lucie Public Schools (Fla.) | 410 | 303 | 0 | 24,878 | 6,538,225 |
34 | Albuquerque Public Schools (N.M.) | 400 | 320 | 44 | 33,634 | 4,152,096 |
35 | Atlanta Public Schools (Ga.) | 385 | 283 | 0 | 28,000 | 3,981,380 |
36 | Garland ISD (Texas) | 370 | 272 | 0 | 14,500 | 4,900,000 |
37 | Portland School District (Ore.) | 368 | 319 | 248 | 10,823 | 3,476,207 |
38 | School District U-46, Elgin (Ill.) | 340 | 245 | 0 | 23,000 | 3,800,000 |
39 | Special School District (Mo.) | 332 | 245 | 125 | 4,300 | 4,495,733 |
40 | Henry County Schools (Ga.) | 326 | 296 | 0 | 22,000 | 5,500,000 |
41 | Anoka-Hennepin Schools (Minn.) | 325 | 295 | 295 | 29,000 | 7,100,000 |
42 | Beaverton School District (Ore.) | 320 | 270 | 0 | 25,000 | 3,000,000 |
43 | Leander ISD (Texas) | 320 | 170 | 0 | 14,000 | 2,000,000 |
44 | Stafford County Public Schools (Va.) | 319 | 247 | 0 | 19,000 | 4,500,000 |
45 | Denver Public Schools (Colo.) | 309 | 194 | 0 | 5,509 | 1,758,806 |
46 | Bossier Parish Schools (La.) | 307 | 233 | 0 | 13,250 | 3,160,000 |
47 | Indianapolis Public Schools (Ind.) | 306 | 249 | 306 | 15,000 | 4,000,000 |
48 | Salem-Keizer Public Schools (Ore.) | 303 | 224 | 0 | 10,150 | 3,151,559 |
49 | St. Paul Public Schools (Minn.) | 283 | 257 | 320 | 25,339 |
|
50 | Anchorage School District (Alaska) | 280 | 210 | 88 | 22,000 | 1,500,000 |
*based on districts that participated in the survey
Did we miss you on this list? Please email info@schoolbusfleet.com with your district’s name, number of route buses, and contact info, and we’ll send you the survey when we’re compiling the next Top Districts list next year. If you have about 150 or more school buses in route service (including any that are operated by contractors), you should be in the running.
Topics:Management
Subscribe to Our Newsletter
More Management

Changing Lanes: AMF Bruns, Pro-Vision, CALSTART, HopSkipDrive, & Kooner
Check out who's been hired, promoted, and appointed to leadership positions at various school transportation industry suppliers and nonprofits.
Read More →
NCST Announces 18th Congress Event Dates, New Committees
The National Congress on School Transportation moves to St. Louis in May 2029, convening delegates and industry representatives to discuss new best practice recommendations. Now, the new committee chairs have been named.
Read More →
Key Moments from the 2026 NSTA Annual Meeting in the Mile High City
From federal policy updates and OEM presentations to speed networking and industry awards, see photos and highlights from the contractor association’s summer conference in Denver.
Read More →

HopSkipDrive Launches Spanish-Language App Update, Plans Additional Language Support
The update aims to improve communication with multilingual families by offering ride tracking, notifications, and support in Spanish, with more languages planned for the 2026-2027 school year.
Read More →
Where the Yellow Bus Takes Us: School Bus Fleet's 2026 Photo of the Year Winners
See the winning photos from School Bus Fleet's 2026 Photo of the Year contest, featuring stunning school bus images from across the U.S., from scenic landscapes to everyday moments.
Read More →
Why Emotional Intelligence Matters in Student Transportation
Learn the five key elements that bus drivers and transportation directors can use to stay calm in any situation.
Read More →
Sponsored•July 23, 2026
2026 Back-To-School Readiness Report
Staffing gaps, flat budgets, and the distance between “mostly prepared” and ready for the 2026-2027 school year.
Read More →
National School Transportation Association Presents 2026 Award Winners
Twenty-one individuals and contractor companies were recognized for excellence in student transportation at NSTA's annual meeting and convention in Denver.
Read More →
School Transportation Data Is Only as Powerful as the Story It Tells
Leaders say turning operational metrics into student-centered narratives can help districts justify investments and improve service.
Read More →
Photos: NYAPT Celebrates 50 Years at 2026 Conference & Trade Show
See highlights from NYAPT's 50th anniversary conference in Saratoga Springs, featuring educational sessions, awards, a trade show, networking, and more.
Read More →