


See Also: 2025 School Bus Sales Report
K-12 Student Transportation Statistics 2024-25
Get the latest state-by-state student transportation statistics, including total buses, drivers, students transported, miles driven, and more, for the most recent school year. Sponsored by First Light Safety Products.
December 8, 2025
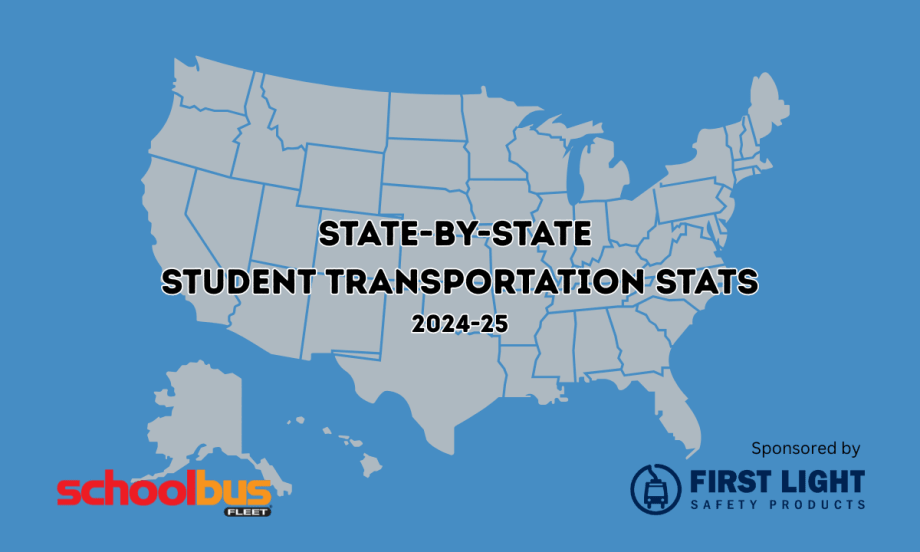
How does each U.S. state measure up to others' student transportation statistics? Find out in this annual report.
Photo: School Bus Fleet
4 min to read
Every year, School Bus Fleet rounds up key K-12 public transportation statistics from every single U.S. state to find out how each compares — and to find a nationwide snapshot of the industry. So, here's what we found out for the most recent school year.
State-by-State School Bus Statistics — 2024-25
State | Total # Yellow Buses | Total # Contractor-Owned Buses | Total # Bus Drivers | Public K-12 Students Transported Daily | Public K-12 Students Enrolled | % of Public K-12 Students Transported | Total Annual Route Mileage | Total State Aid Paid for Student Transportation |
|---|---|---|---|---|---|---|---|---|
Alabama* | 9,984 | 352 | 11,800 | 329,837 | 729,242 | 45% | 89,370,000 | $385,850,572.00 |
Alaska | 933 | 655 | 766 | 73,968 | 126,729 | 58% | 10,001,324 | $70,743,841.00 |
Arizona | 6,903 | 184 | 5,878 | Not Available | 1,079,633 | Not Available | Not Available | Not Available |
Arkansas | 5,339 | 292 | 8,616 | 338,653 | 466,818 | 73% | 47,045,700 | Not Available |
California | 28,594 | 16,303 | 70,000** | Not Available | 5,806,221 | Not Available | 195,405,339 | $836,312,454.00** |
Colorado* | Not Available | Not Available | Not Available | 279,043 | 881,065 | 32% | 46,765,451 | $71,845,006.00 |
Connecticut | 10,000** | Not Available | Not Available | 330,000 | 508,402 | 65% | Not Available | Not Available |
Delaware | 1,713 | 1,038 | 2,000 | 127,595** | 142,495 | 90% | 20,826,189** | $180,406,200.00 |
Florida* | 16,928 | Not Available | 10,361 | 998,814 | 2,851,850 | 35% | 208,593,814 | $1,263,466,978.00 |
Georgia | 20,488 | Not Available | 13,964 | 885,615 | 1,683,786 | 53% | 133,644,780 | $148,750,195.00 |
Hawaii | 792 | 732 | 565 | 25,885 | 165,340 | 16% | 8,708,926 | $84,736,557.00 |
Idaho | 3,207 | 1,070 | Not Available | 84,006 | 306,937 | 27% | 208,658,070 | $127,688,576.00 |
Illinois | 26,403 | Not Available | 33,618 | 963,359 | 1,900,000 | 51% | 213,841,424 | $809,366,100.00 |
Indiana | 15,534 | 1,934 | 15,859 | 676,123** | 1,040,190 | 65% | Not Available | $0.00 |
Iowa | 6,299 | 1,346 | 12,721 | 222,988 | 480,665 | 46% | 38,453,949 | $217,848,616.00 |
Kansas* | 3,900 | 1,169 | 9,301 | 192,852 | 478,858 | 40% | 34,208,401 | $112,316,612.00 |
Kentucky | 8,953 | Not Available | 8,224 | 301,583* | 635,563 | 48%* | 101,665,365 | $367,321,500.00 |
Louisiana | Not Available | Not Available | Not Available | Not Available | 673,801 | Not Available | Not Available | Not Available |
Maine | 3,400 | 13 | 2,674 | 144,000 | 171,055 | 84% | 276,000 | Not Available |
Maryland | 8,633 | 3,918 | 8,716 | 631,784 | 891,553 | 71% | 118,591,491 | $363,354,268.00 |
Massachusetts* | 9,700 | 7,850** | 9,570 | 400,000** | 915,932 | 44% | Not Available | Not Available |
Michigan | 16,246 | Not Available | 17,000 | 700,000 | 1,427,386 | 49% | 162,000,000 | $128,925,000.00 |
Minnesota | 19,663 | 14,417 | Not Available | 724,160 | 876,746 | 83% | 165,982,966 | $394,399,188.89 |
Mississippi | 5,062 | 284* | Not Available | 367,386 | 426,523 | 86% | 35,050,826 | $225,937,857.00* |
Missouri | 11,258 | Not Available | Not Available | 437,172 | 859,355 | 51% | 123,379,613 | $361,366,614.00 |
Montana | 3,815 | 2,308 | 2,072 | 60,573 | 144,456 | 42% | 15,251,034 | $10,521,907.48 |
Nebraska | 3,470 | Not Available | Not Available | 46,129 | 331,459 | 14% | 16,508,838 | Not Available |
Nevada* | 2,340 | 20 | 1,708 | 144,833 | 479,578 | 30% | 38,038,736 | $38,814,640.22 |
New Hampshire | 3,400 | Not Available | 3,324 | 159,000** | 162,660 | 98%** | Not Available | $832,858.05 |
New Jersey* ** | 21,700 | Not Available | Not Available | 775,000 | 1,381,182 | 56% | Not Available | $516,230,692.00 |
New Mexico | 1,897 | 680 | Not Available | 123,905* | 295,264 | 42%* | Not Available | $133,793,300.00 |
New York | 50,000 | 30,000** | 34,340* | 2,185,000** | 2,215,936 | 95% | Not Available | $2,000,000,000.00 |
North Carolina | 10,713 | Not Available | 11,281 | 609,949 | 1,538,563 | 40% | 147,259,555 | $672,903,362.00 |
North Dakota | 2,073 | Not Available | 526 | 39,802 | 116,598 | 34% | 21,522,477 | $24,352,888.00 |
Ohio | 10,784 | 1,225 | 18,842 | 734,229 | 1,680,029 | 44% | 204,022,800 | $819,787,000.00 |
Oklahoma* | Not Available | Not Available | Not Available | Not Available | 697,358 | Not Available | Not Available | Not Available |
Oregon | 5,726 | 2,399 | Not Available | 242,003 | 545,088 | 44% | 52,506,647 | Not Available |
Pennsylvania* | 28,943 | Not Available | 43,272 | 1,408,211 | 1,742,819 | 81% | 435,162,966 | Not Available |
Rhode Island | Not Available | Not Available | Not Available | Not Available | 135,978 | Not Available | Not Available | $12,470,802.00 |
South Carolina | 7,030 | 110 | 5,400 | 361,000 | 798,267 | 45% | 78,456,279 | $175,000,000.00 |
South Dakota | 1,849 | 371 | 3,400 | 54,925 | 137,313 | 40% | 13,127,123 | $52,921,000.00 |
Tennessee | 9,500 | 2,550 | 9,228*** | 510,483 | 971,741 | 53% | 99,750,000 | Not Available |
Texas* | 45,745 | 0 | Not Available | 1,712,929 | 5,504,150 | 31% | 354,193,790 | $395,223,070.00 |
Utah | 3,151 | 44 | 3,204 | 188,079 | 672,662 | 28% | 25,188,512 | $125,605,896.00 |
Vermont | Not Available | Not Available | 2,202 | 61,658 | 84,463 | 73% | Not Available | $23,520,000.00 |
Virginia | 15,012 | 115 | 16,135 | 777,845 | 1,258,792 | 62% | 200,951,970 | $868,989,334.00 |
Washington | 10,166 | 1,197 | 10,557 | 344,927 | 1,105,384 | 31% | 91,261,056 | $754,032,800.80 |
West Virginia | 3,950 | 0 | 2,775 | 172,011 | 241,024 | 71% | 41,105,909 | $99,231,183.00 |
Wisconsin | Not Available | Not Available | Not Available | 372,120 | 805,881 | 46% | Not Available | $46,800,000.00 |
Wyoming | 1,845 | 0 | 655 | 26,731 | 90,204 | 30% | 11,862,745 | Not Available |
TOTAL | 483,041 | 92,576 | 410,554 | 20,346,165 | 48,662,994 |
| 3,808,640,065 | $12,921,666,868.44 |
AVERAGE | 10,978 | 2,986 | 11,730 | 452,137 | 973,260 | 52% | 102,936,218 | $340,043,864.96 |
*Latest available data.
**Estimate.
***Includes office staff.
Note: Many states don’t track or provide data in all categories, so these totals and averages don’t necessarily capture an accurate nationwide picture.
Get more industry information and statistics in School Bus Fleet's 2026 Fact Book, available in full Dec. 11, 2025.
Previous Reports
Our Data Collection Methodology
School Bus Fleet gathers state-level school transportation data directly from each state’s designated transportation authority. In most cases, this comes from state departments of education, though some states report through their highway patrol, department of public safety, or equivalent agencies. Data is collected annually by email and phone inquiries from state transportation directors as compiled from their school districts. Because states track different metrics, not all data points are available in every state. When a state no longer reports specific metrics or is unresponsive, we note the use of prior-year data with an asterisk.
More Management

Changing Lanes: AMF Bruns, Pro-Vision, CALSTART, HopSkipDrive, & Kooner
Check out who's been hired, promoted, and appointed to leadership positions at various school transportation industry suppliers and nonprofits.
Read More →
NCST Announces 18th Congress Event Dates, New Committees
The National Congress on School Transportation moves to St. Louis in May 2029, convening delegates and industry representatives to discuss new best practice recommendations. Now, the new committee chairs have been named.
Read More →
Key Moments from the 2026 NSTA Annual Meeting in the Mile High City
From federal policy updates and OEM presentations to speed networking and industry awards, see photos and highlights from the contractor association’s summer conference in Denver.
Read More →

HopSkipDrive Launches Spanish-Language App Update, Plans Additional Language Support
The update aims to improve communication with multilingual families by offering ride tracking, notifications, and support in Spanish, with more languages planned for the 2026-2027 school year.
Read More →
Where the Yellow Bus Takes Us: School Bus Fleet's 2026 Photo of the Year Winners
See the winning photos from School Bus Fleet's 2026 Photo of the Year contest, featuring stunning school bus images from across the U.S., from scenic landscapes to everyday moments.
Read More →
Why Emotional Intelligence Matters in Student Transportation
Learn the five key elements that bus drivers and transportation directors can use to stay calm in any situation.
Read More →
Sponsored•July 23, 2026
2026 Back-To-School Readiness Report
Staffing gaps, flat budgets, and the distance between “mostly prepared” and ready for the 2026-2027 school year.
Read More →
National School Transportation Association Presents 2026 Award Winners
Twenty-one individuals and contractor companies were recognized for excellence in student transportation at NSTA's annual meeting and convention in Denver.
Read More →
School Transportation Data Is Only as Powerful as the Story It Tells
Leaders say turning operational metrics into student-centered narratives can help districts justify investments and improve service.
Read More →
Photos: NYAPT Celebrates 50 Years at 2026 Conference & Trade Show
See highlights from NYAPT's 50th anniversary conference in Saratoga Springs, featuring educational sessions, awards, a trade show, networking, and more.
Read More →