


See Also: School Bus Sales Dip 2% in 2024
K-12 Student Transportation Statistics 2023-24
The latest state-by-state student transportation statistics for the most recent school year, sponsored by First Light Safety.
December 10, 2024
Photo: SBF/Canva
1 min to read
How does each U.S. state measure up to its student transportation statistics?
School Bus Fleet contacted all 50 states' department directors to find out. We asked each to share as much updated information as possible.
Here's the report!
State-by-State School Bus Statistics - 2023-24
| State | Total # Yellow Buses | Total # Contractor-Owned Buses | Total # Bus Drivers | Public K-12 Students Transported Daily | Public K-12 Students Enrolled | % of Public K-12 Students Transported | Total Annual Route Mileage | Total State Aid Paid for Student Transportation |
|---|---|---|---|---|---|---|---|---|
| Alabama | 9,984 | 352 | 15,301 | 329,837 | 720,468 | 46% | 89,370,000 | $385,850,572 |
| Alaska | 925 | 657 | 715 | 71,844 | 128,275 | 56% | 9,688,450 | $70,743,841 |
| Arizona | 7,081 | 161 | 5,385 | Not Available | 1,115,160 | Not Available | Not Available | Not Available |
| Arkansas | 5,223 | Not Available | 8,367 | 339,948 | 436,796 | 78% | 84,836,600 | Not Available |
| California | 21,736 | 9,422 | 66,000 | 1,100,000 | 5,837,690 | 19% | 202,612,287 | $1,800,000 |
| Colorado | Not Available | Not Available | Not Available | 279,043 | 881,464 | 32% | 46,765,451 | $71,845,006 |
| Connecticut* | 8,600 | 8,250 | Not Available | 467,000 | 512,652 | - | Not Available | Not Available |
| Delaware | 1,711 | 1,079 | 2,144 | 127,250 | 142,157 | 90% | 20,810,604 | $166,833,900 |
| District of Columbia | Not Available | Not Available | Not Available | Not Available | 98,663 | Not Available | Not Available | Not Available |
| Florida* | 17,388 | Not Available | 10,414 | 847,952 | 2,851,850 | 30% | 204,014,432 | $1,273,553,604 |
| Georgia | 20,506 | Not Available | 13,738 | 880,998 | 1,693,856 | 52% | 137,282,220 | $148,750,195 |
| Hawaii | 785 | 725 | 437 | 28,260 | 167,649 | 17% | 4,527,500 | $85,000,000 |
| Idaho | 2,985 | Not Available | Not Available | 90,000 | 315,141 | 28% | 20,970,348 | $94,400,000 |
| Illinois* | 23,065 | Not Available | 32,098 | 976,971 | 1,861,774 | 52% | 215,587,529 | $809,366,100 |
| Indiana | 15,540 | 1,971 | 14,151 | 671,270** | 1,032,724 | 65% | Not Available | Not Available |
| Iowa* | 6,000 | 900 | 9,000 | 223,345 | 478,692 | 47% | 38,501,255 | $210,557,708 |
| Kansas* | 3,495 | 1,220 | 9,176 | 196,148 | 475,233 | 41% | 33,518,081 | $3,817,084,539 |
| Kentucky | 8,977 | Not Available | 8,364 | 301,583 | 634,424 | 48% | 99,816,332 | $274,446,300 |
| Louisiana | Not Available | Not Available | Not Available | Not Available | 1,360,046 | Not Available | Not Available | Not Available |
| Maine | 3,400 | 0 | 2,850 | 138,099 | 172,624 | 80% | 30,000,000 | $5,000,000 |
| Maryland | 7,169 | 3,301 | 8,580 | 628,866 | 889,900 | 71% | 122,401,833 | $335,964,983 |
| Massachusetts | 9,000 | 7,850 | 10,000 | 500,000 | 914,959 | 55% | Not Available | Not Available |
| Michigan | 15,000 | Not Available | Not Available | 700,000 | 1,429,895 | 49% | Not Available | Not Available |
| Minnesota | 18,332 | 13,583 | Not Available | 682,399 | 870,506 | 78% | 160,134,264 | $373,985,043 |
| Mississippi* | 5,534 | 284 | Not Available | 368,644 | 439,787 | 84% | 38,132,316 | $225,937,857 |
| Missouri* | 11,678 | 3,950 | Not Available | 464,322 | 861,494 | 54% | 123,379,100 | 347,297,933 |
| Montana | 3,740 | 2,281 | 2,013 | 74,780 | 148,585 | 50% | 15,468,935 | $10,411,642 |
| Nebraska | 5,398 | Not Available | Not Available | 86,599 | 328,649 | 26% | 27,152,911 | Not Available |
| Nevada | 2,320 | 0 | 2,000 | 145,000 | 484,240 | 30% | 24,802,999 | $26,765,997 |
| New Hampshire* | 3,200 | Not Available | Not Available | 159,600 | 155,253 | Not Available | Not Available | Not Available |
| New Jersey* | 16,704 | 4,677 | Not Available | 677,045 | 1,343,058 | 50% | Not Available | $328,421,850 |
| New Mexico | 1,975 | Not Available | Not Available | 123,905 | 295,236 | 42% | Not Available | $126,821,800 |
| New York | 50,000** | 22,800* | Not Available | 2,300,000** | 2,418,513 | 95% | Not Available | $2,000,000,000** |
| North Carolina | 10,871 | Not Available | 11,281 | 622,640 | 1,374,664 | 45% | 154,082,167 | $675,388,863 |
| North Dakota* | 2,351 | 284 | Not Available | 43,585 | 116,598 | 38% | 22,564,317 | $27,638,204 |
| Ohio | Not Available | Not Available | 18,902 | 715,881 | 1,665,552 | 43% | 1,119,933 | $773,000,070 |
| Oklahoma | Not Available | 21 | Not Available | Not Available | 701,066 | Not Available | Not Available | $37,165,015 |
| Oregon* | 4,429 | 2,086 | Not Available | 173,740 | 552,380 | 31% | 50,351,936 | Not Available |
| Pennsylvania | 28,637 | 42,117 | 43,173 | 1,412,379 | 1,685,859 | 84% | 434,649,271 | Not Available |
| Rhode Island* | 1,691 | 1,356 | Not Available | 94,800 | 137,452 | - | Not Available | $558,024,000 |
| South Carolina | 5,740 | 100 | 5,600 | 330,000 | 751,000 | 44% | 77,000,000 | $136,000,000 |
| South Dakota* | 1,778 | 782 | Not Available | 43,876 | 137,759 | 39% | Not Available | Not Available |
| Tennessee | 8,653 | Not Available | 3,815 | 467,745 | 1,000,920 | 47% | Not Available | Not Available |
| Texas* | 45,347 | 0 | Not Available | 1,548,374 | 5,402,928 | 29% | 341,827,721 | $385,607,193 |
| Utah | 3,151 | 44 | 3,204 | 190,945 | 672,662 | 28% | 25,188,512 | $124,066,041 |
| Vermont | Not Available | Not Available | 2,364 | 63,005 | 82,901 | 76% | Not Available | $21,786 |
| Virginia | 15,124 | 168 | Not Available | 759,011 | 1,261,962 | 60% | 202,868,629 | $409,500,000 |
| Washington | 10,345 | 1,311 | 10,000 | 339,367 | 1,070,679 | 32% | 96,759,250 | $841,000,000 |
| West Virginia | 3,835 | 0 | 3,663 | 174,019 | 245,047 | 71% | 43,845,002 | $99,231,183 |
| Wisconsin | Not Available | Not Available | Not Available | 369,762 | 814,002 | 45% | Not Available | $24,000,000 |
| Wyoming | 1,835 | 0 | 657 | 26,747 | 90,297 | 30% | 11,861,500 | Not Available |
| TOTAL | 451,238 | 131,732 | 323,392 | 21,356,584 | 49,261,141 | - | 3,211,891,685 | $15,281,481,225 |
| AVERAGE | 10,255 | 3,992 | 11,151 | 454,395 | 965,905 | 50% | 94,467,403 | $424,485,590 |
*Latest available data.
**Estimate.
Note: Many states don’t track or provide data in all categories, so these totals and averages don’t necessarily capture an accurate nationwide picture.
Previous Reports
Get more industry information and statistics in School Bus Fleet's 2025 Fact Book, available in full Dec. 18, 2024.
More Management
School Transportation Data Is Only as Powerful as the Story It Tells
Leaders say turning operational metrics into student-centered narratives can help districts justify investments and improve service.
Read More →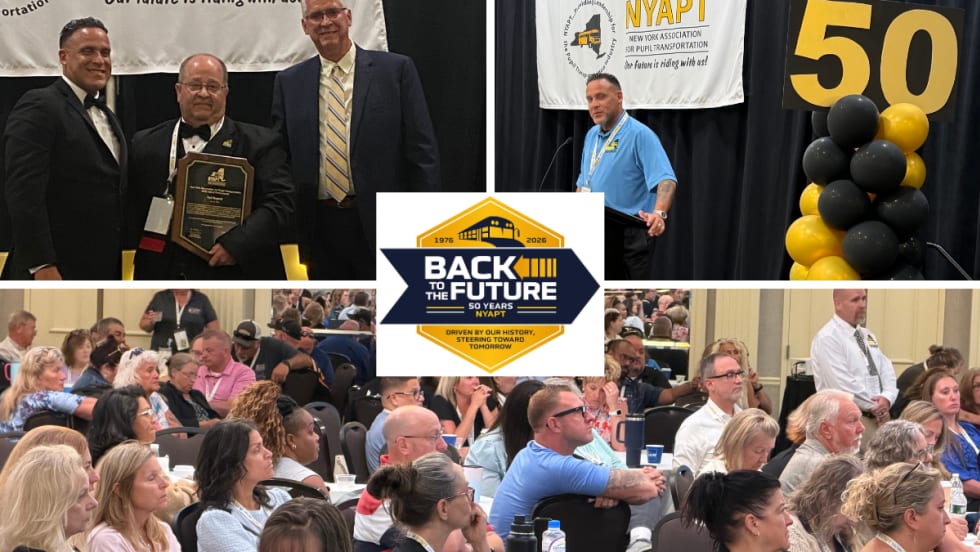
Photos: NYAPT Celebrates 50 Years at 2026 Conference & Trade Show
See highlights from NYAPT's 50th anniversary conference in Saratoga Springs, featuring educational sessions, awards, a trade show, networking, and more.
Read More →
Ohio Transportation Workgroup Calls for End to 'Impractical to Transport' Payments
A final report from Ohio's Pupil Transportation Workgroup proposes ending "impractical to transport" payments and expanding transportation options through regional partnerships, but not all industry pros agree on the approach.
Read More →

Transfinder Expands California Footprint with Multiple School District Wins
Six California school districts selected the company's routing platform and related transportation technology as Transfinder continues expanding its presence across the state.
Read More →
NSTA's Curt Macysyn on Student Transportation History and What's Next
Hear from NSTA's executive director as we discuss student transportation's role in American history, federal regulation, driver recruitment, illegal passing, AI, and what might be next, in this Route interview.
Read More →
NSTA on 250 Years of America and the Road Ahead for Student Transportation
Curt Macysyn joins The Route to discuss student transportation's role in American history, federal regulation, driver recruitment, illegal passing, AI, and the industry’s future. Sponsored by IC Bus.
Read More →
Photo Highlights: Inside the 2026 Michigan Association for Pupil Transportation Conference
Snapshots from the 2026 MAPT conference, where Michigan's school transportation professionals gathered for training, technology updates, awards, networking, and more.
Read More →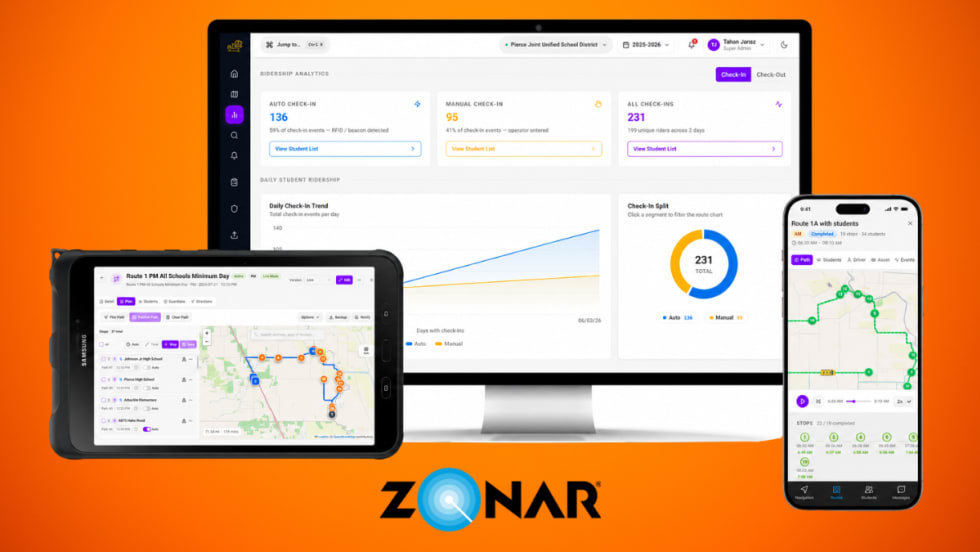
Zonar Launches Reimagined Bus Suite Web Portal
Can one platform replace your transportation software stack? Zonar says its new Bus Suite unifies routing, dispatch, field trips, GPS, and parent communication.
Read More →
Indiana Association Announces 2026 Award Winners
See who earned top honors at the 2026 School Transportation Association of Indiana conference, recognizing excellence in school transportation statewide.
Read More →
Student Transportation of America Acquires Massachusetts Contractor
Tremblay’s Bus Company and its 400-bus fleet joins the STA family of brands as the company grows its presence across the Northeast U.S.
Read More →