

Drilling Down on Fleet Maintenance: Part 3 of 3
In the July issue of SBF, I discussed what is involved with maintaining a fleet of vehicles and introduced you to 10 sources that are ...
In the July issue of SBF, I discussed what is involved with maintaining a fleet of vehicles and introduced you to 10 sources that are used to identify how work is generated. In the August issue (pg. 40), I illustrated how to figure labor costs, explained desirable and undesirable work sources, and shared the essentials of data gathering. In this third installment, I will cover analyzing the data you have gathered and illustrate its purpose. After you have spent so much time entering those work orders, it pays to analyze the data you have recorded.
Charting repair history
Without properly recording repairs, analysis becomes more difficult. It is helpful if you routinely compare the number and types of parts being purchased for the types of repairs you are making. A high percentage of like replacement parts being purchased may indicate that there is a problem with an existing part, that insufficient routine maintenance is taking place, that a lubricant change needs to be made, or that bus specifications need to be upgraded.
All this information can be charted in a number of formats to make a visual representation of what is taking place. You may not wish to chart it out at all if you have good numbers recorded and can form some type of analysis from your records. I recommend having supporting data to back up any claim you make. Charts help back up your justification.
If your fleet is functioning properly, your records should indicate higher levels of lubricants, fluids and filters as well as higher labor hours recorded performing routine preventive maintenance (PM), but this should also be scrutinized as well. Performing oil analysis routinely is the only sure way to make certain that oil changes are not being performed prematurely or too infrequently. Utilize every tool at your disposal to inform your actions.
Interpreting data and spotting trends
The data in Chart 1 is representative of all maintenance for a period of about eight years. Charting data for such a long period tells you how you are doing overall, but it doesn’t show the detail that would allow you to adjust your maintenance program routinely.
Click Here to view Chart 1 According to Chart 1, the maintenance program appears to be working very well. You can see that the combined sources of inspection, PM schedule, scheduled and VCR (vehicle condition report) make up almost all of the work being performed.
If the chart data indicated higher percentages of road calls, accidents and drive-in repairs, your recorded data would show deficiencies in the PM and scheduled repairs.
Click Here to view Chart 2 Chart 2 indicates where specific types of work are taking place. This series of data is coded by job and is based on the same fleet data used in Chart 1. Job coding is another feature of computerized maintenance programs and is essential in the report- building process.
In Chart 2, you can see that the majority of all work being performed is shown in total PM. I have lumped together all PM in Chart 2 since it is not important for this purpose to see the individual PM, but rather how they relate all together.
The next highest type of repair by job code shows that 20 percent of all repairs have to do with some sort of electrical repair. This high of a percentage of electrical problems may indicate that component quality needs to be improved or that repair procedures may need to be changed. I would prefer to see the percentage of electrical repairs be much lower; however, one can expect electrical repairs to be slightly high due to the large number of electrical components on a school bus. This may vary between geographical areas due to varying operating conditions of a fleet.
Charting more detailed information is also helpful. If you wanted to see the percentage of individual electrical repairs, you could find out what electrical repair was costing you the most. Note that the percentage of compressed air system and brake repairs shown are relatively small, yet body and paint is showing 6 percent. This fleet has had a higher percentage of accidents that are winter related. From my experience with this fleet, I know that driver error is partially to blame. Improved care by the driver will help lower this percentage. This is where you ask for help from your driver trainer.
I will now compare how parts and labor costs relate to each of the job coded areas listed in Chart 2. In Chart 3, let’s examine the higher percentages first. On the labor line, body and paint, electrical, and PM are the highest items. On the parts line, body and paint, electrical, tires, and PM are the highest.
Click Here to view Chart 3 This type of information only tells me where the highest expenses have occurred for the combination of years that the data covers, which is an eight-year period. The information does, however, make me think about why certain expenses are higher and creates an opportunity to try to lower expenses in those areas.
If I were to show the illustrated changes for each year rather than an eight-year period, comparing year-to-year trend lines for these categories would be more meaningful. I would be able to track highs and lows and report by year why these changes took place. Body and paint repairs are usually relative to the number of accidents or are related to climate conditions. Periods of good weather will usually illustrate lower body repairs. If a trend line is increasing year after year, it is important to analyze why. This analysis will indicate to you what needs to happen to correct a growing trend.
Note the items in Chart 3 with higher labor costs compared to their respective parts cost. This is understandable since the maintenance involved in all of these areas is labor intensive to complete it properly. So why is it important to study the data and graph it out?
First, the graphs give a visual aid to help explain the data. They are not necessary, but if all you have is data, the record will become more difficult to understand and explain to those higher up who manage the purse strings. To really understand what the meaning of all this is, you have to examine the data routinely — at least annually — to build a trend line history where you can track changes and the highs and lows, and then recognize and understand why the highs and lows occurred. The information-gathering process should be a part of your daily work process. No work should be done without a documented record.
The importance of record-keeping
You may be asking, “Why do I need to document every action and be able to build a report? How can this benefit our organization?” Or you may understand fully and perhaps your methods are more extensive than mine. What I have discovered in my 36 years of working as a mechanic and supervisor is basically this:
1. Some sort of documentation and record keeping must take place.
2. The more detail you can record, the more accurate and informative your records become.
3. Records will be used in a variety of ways to manage the operation, regardless of fleet size.
4. Having readily available records speeds up the work process.
5. Records give credence to your operational actions and needs.
6. Records can back you up in a court of law.
Analyzing data and building reports is time consuming, but compared to trying to organize an accurate report of your operation when all you have is stacks of paper, the electronic data becomes well worth the effort.
Brad Barker is shop manager at Park City (Utah) School District and a member of SBF’s editorial advisory board.
More Maintenance

Cummins on Smarter, Simpler Engine Innovation
Cummins discusses its first-ever gasoline engine for school buses, EPA 2027, and why bus fleets still want durable, simpler internal combustion options.
Read More →
Report: 72% of Diesel School Buses Now Use Advanced Low-Emission Engines
New data shows advanced low-emission diesel technology continues expanding across school bus fleets, even as electric bus adoption gains momentum.
Read More →
Vampire Tools' CAIMAN 7.5-Inch Multi-Purpose Screw Extractor Long-Nose Pliers with Crimper
Vampire Tools introduced the VAMPLIERS Caiman 7.5-inch multi-purpose pliers, combining screw extraction, cutting, crimping, and gripping functions into a single tool designed for fleet maintenance professionals.
Read More →
How Advanced Diagnostics Helps Bus Fleets Stay Ahead of Repairs
Chat with Noregon’s Kevin Smallhorn at ACT Expo about bus diagnostic tools, telematics integration, CNG maintenance support, and strategies to help reduce downtime and improve uptime.
Read More →
How School Bus Fleets are Getting Ahead of Breakdowns
Don’t let bus downtime wear you down. Here’s how bus operators are shifting from manual processes to AI-powered, data-driven maintenance systems for improved reliability and safety.
Read More →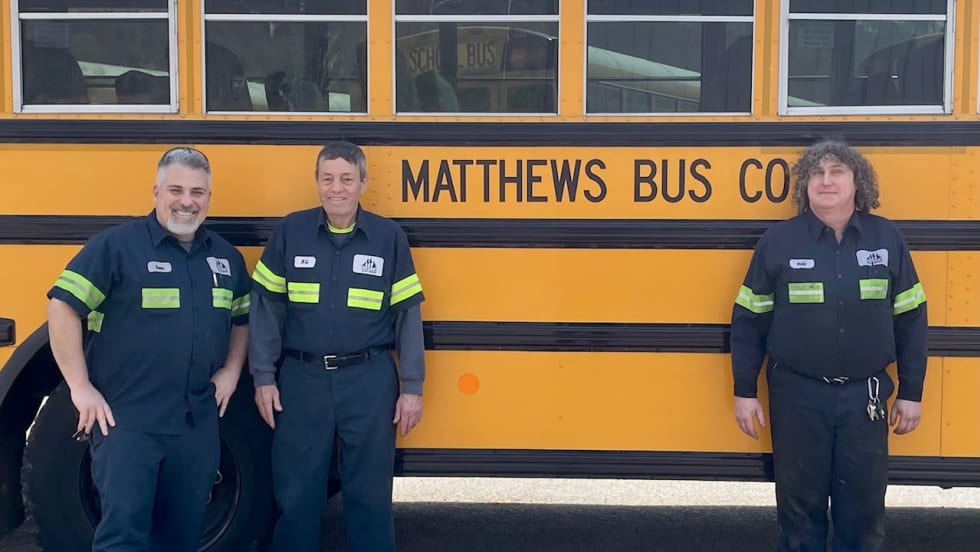
Pennsylvania School Bus Maintenance Team Praised for Dedication to Safety
Matthews Bus Company’s West Jefferson received a letter of commendation from the Pennsylvania State Police for their fleet inspections.
Read More →
2026 State of Student Transportation Report
Student transportation teams are being asked to do more with less, facing driver shortages, rising costs, and increasing safety expectations. This report uncovers how fleets are adapting, where technology is making the biggest impact, and why student ridership tracking is emerging as a top priority. Download the report to explore the key trends shaping 2026 and what they mean for your operation.
Read More →
From Chaos to Clarity: How School Districts Are Running Leaner Transportation Operations
Covering 38 routes on a Friday afternoon. Buses idling while routes overlap. Parents calling nonstop about late arrivals. Sound familiar? This whitepaper explores how district transportation leaders solved these exact problems — and what measurable results followed.
Read More →
The New Playbook for Safer, Smarter School Bus Maintenance
As school districts juggle aging buses, technician shortages and rising safety expectations, proactive fleet maintenance is becoming essential. This guide explores how telematics, predictive maintenance and real-time vehicle data can help transportation departments reduce breakdowns, extend vehicle life, improve compliance and keep students safer on the road.
Read More →
2026 School Bus Fleet Vendor Directory & Buyer's Guide
Searching for the right equipment, technology, or services for your school transportation program? This industry guide brings together manufacturers and suppliers across the entire school bus market, all in one place. Download it to find the partners who can help move your operation forward.
Read More →