


DID YOU MISS: NASDPTS 2023: School Transportation Industry Facing Change While Rebounding
Georgia School District Fleet Holds Top Spot for Third Year
Meanwhile, severe driver shortages appear to be diminishing, according to our latest School Bus Fleet survey of United States school districts.
November 15, 2023
Image: Canva/Gwinnett County (Ga.) Schools
4 min to read
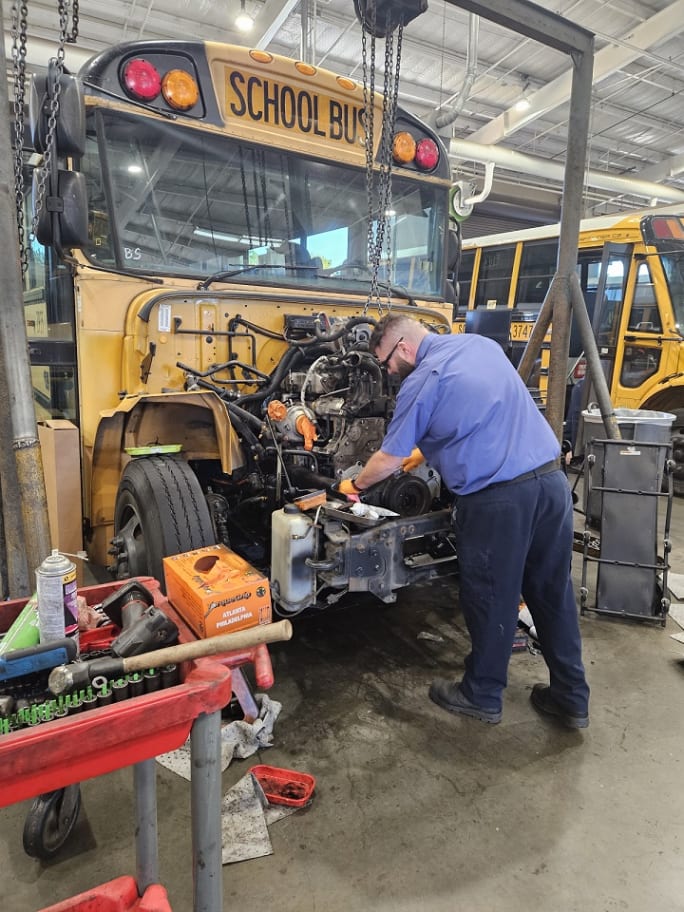
A school bus technician works on one of the school buses in the Gwinnett County (Ga.) Schools fleet, which once again came in first for our fleets in the 2023 School Bus Fleet survey.
Photo: Gwinnett County (Ga.) Schools
Is the worst behind us when it comes to the nationwide school bus driver shortage?
That may well be the case, based on responses from participants in the 2023 School Bus Fleet Top District Fleets survey, which indicates that 62% of school districts are facing moderate to desperate levels vital personnel behind the wheel. That’s down 10% compared to 2022, and down 26% compared to 2021.
Gwinnett County, a Georgia school district that came in first place among responding districts in the survey, reports that it is fully staffed with bus drivers.
“We continue to recruit, hire, and train drivers year-round to ensure we always have the drivers we need, planning proactively for the turnover that we know will occur at certain times during the year,” says Charley Humble, Gwinnett’s transportation director. “Our transportation team has a dedicated recruiting department, and they work tirelessly to find new and innovative ways to reach potential applicants.”
What else does the survey tell us this year? Consider:
Average starting pay across the country climbed to $21.84, up from $20.89 in 2022.
The average salary for transportation directors was $85,993.67 this year.
About a third of responding school districts indicated their transportation operations are unionized.
Service levels are expected to increase or remain the same in most districts.
Diesel buses appear to be purchased less often, while vehicles fueled by gasoline and alternatives increased.
Top 5 School Bus Fleets Based on Route Buses
RANK | DISTRICT | NO. OF ROUTE BUSES |
1 | Gwinnett County (Ga.) Public Schools | 1,636 |
2 | Broward County (Fla.) Public Schools | 980 |
3 | Jefferson County (Ky.) Public Schools* | 905 |
4 | Hillsborough County (Fla.) Public Schools* | 875 |
5 | Dekalb County (Ga.) Public Schools* | 870 |
* Latest available data
Top 5 School Bus Fleets Based on Ridership
RANK | DISTRICT | STUDENTS TRANSPORTED DAILY |
1 | Gwinnett County (Ga.) Public Schools | 130,000 |
2 | Charlotte-Mecklenburg County (N.C.) Schools | 105,000 |
3 | Cypress-Fairbanks (Texas) Independent School District | 86,000 |
4 | Hillsborough County (Fla.) Public Schools* | 86,000 |
5 | Broward County (Fla.) Public Schools | 73,000 |
*Latest available data.
Top 25 School District Fleets
RANK | DISTRICT | TOTAL SCHOOL BUSES | TOTAL IN DAILY ROUTE OPERATION | CONTRACTOR BUSES | STUDENTS TRANSPORTED | ANNUAL ROUTE MILEAGE |
1 | Gwinnett County (Lawrenceville, GA) | 2,006 | 1,636 | 0 | 130,000 | 24,300,000 |
2 | Broward County Schools (Ft. Lauderdale, FL) | 1,468 | 980 | 0 | 73,000 | 16,250,321 |
3 | Jefferson County (Louisville, KY)* | 1,228 | 905 | 0 | 65,000 | 3,691,451 |
4 | Dekalb County (Tucker, GA)* | 1,150 | 870 | 0 | 67,000 | 12,234,054 |
5 | Hillsborough County (Tampa, FL)* | 1,108 | 875 | 0 | 86,000 | 16,500,000 |
6 | Charlotte-Mecklenburg County Schools (Charlotte, NC) | 1,061 | 836 | 0 | 105,000 | 22,000,000 |
7 | Cypress-Fairbanks ISD (Cypress, TX) | 1,028 | 661 | 0 | 86,000 | 10,000,000 |
8 | Orange County Public Schools (Orlando, FL) | 1,020 | 553 | 0 | 56,000 | 13,000,000 |
9 | Polk County Public Schools (Bartow, FL)* | 645 | 525 | 0 | 50,000 | 9,400,000 |
10 | Greenville County (Taylors, SC)* | 550 | 400 | 0 | 27,500 | 7,200,000 |
11 | Cherokee County (Canton, GA) | 483 | 372 | 0 | 24,361 | 4,900,000 |
12 | Baton Rouge (Baton Rouge, LA) | 440 | 400 | 0 | 43,000 | 1,921,500 |
13 | Albequerque Public Schools (Albequerque, NM) | 395 | 302 | 0 | 30,707 | 4,217,211 |
14 | Garland ISD (Garland, TX) | 393 | 299 | 0 | 17,000 | 4,400,000 |
15 | St. Lucie Public Schools (Port St. Lucie, FL) | 389 | 296 | 0 | 21,000 | 6,500,000 |
16 | School District U-46 (Elgin, IL)* | 350 | 300 | 0 | 25,000 | 4,500,000 |
17 | Lake District Schools (Tavares, Fla.)* | 325 | 240 | 0 | 18,079 | 5,100,000 |
18 | Norfolk Public Schools (Norfolk, VA)* | 323 | 149 | 0 | 7,960 | 1,409,497 |
19 | Carroll County (Westminster, MD)* | 311 | 256 | 0 | 19,000 | 5,300,000 |
20 | Beaverton School District (Beaverton, OR) | 305 | 207 | 0 | 23,793 | 2,382,384 |
21 | Bossier Parish (Bossier City, LA)* | 305 | 227 | 0 | 13,500 | 2,700,000 |
22 | Plano ISD (Plano, TX)* | 300 | 260 | 0 | 15,000 | 3,700,000 |
23 | Mansfield ISD (Mansfield, TX)* | 298 | 197 | 0 | 15,000 | 2,500,000 |
24 | Evergreen Public Schools #114 (Vancouver, WA)* | 292 | 245 | 0 | 11,500 | 2,750,000 |
25 | Salem-Keizer (Salem, OR) | 290 | 225 | 0 | 9,188 | 3,253,899 |
* Latest available data.
Average No. of Buses Per District
292
Average % of Buses Per District Used in Daily Route Operation
76%
Average % of Buses Per District Operated by Contractors
7%
Average Student Passengers Per District
8,611
Total Annual Route Miles Driven by Responding Districts
135,249,306
Average Annual Route Miles Driven by Responding Districts
1,610,111
Average No. of Bus Drivers Per Responding District
97
Average Starting Hourly Pay for School Bus Drivers
$21.84
Get the full report in print and digital editions of November's School Bus Fleet magazine!
Subscribe to Our Newsletter
More Management

Changing Lanes: AMF Bruns, Pro-Vision, CALSTART, HopSkipDrive, & Kooner
Check out who's been hired, promoted, and appointed to leadership positions at various school transportation industry suppliers and nonprofits.
Read More →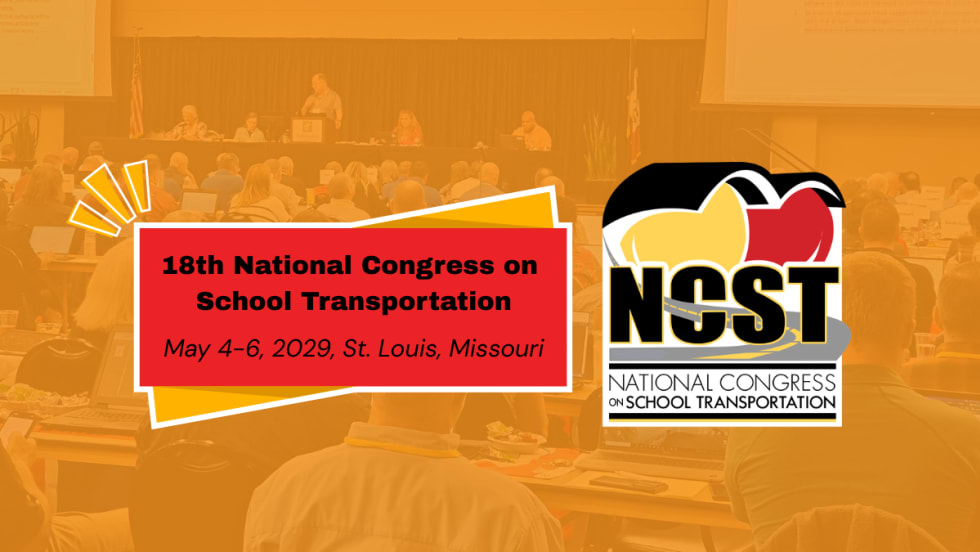
NCST Announces 18th Congress Event Dates, New Committees
The National Congress on School Transportation moves to St. Louis in May 2029, convening delegates and industry representatives to discuss new best practice recommendations. Now, the new committee chairs have been named.
Read More →
Key Moments from the 2026 NSTA Annual Meeting in the Mile High City
From federal policy updates and OEM presentations to speed networking and industry awards, see photos and highlights from the contractor association’s summer conference in Denver.
Read More →

HopSkipDrive Launches Spanish-Language App Update, Plans Additional Language Support
The update aims to improve communication with multilingual families by offering ride tracking, notifications, and support in Spanish, with more languages planned for the 2026-2027 school year.
Read More →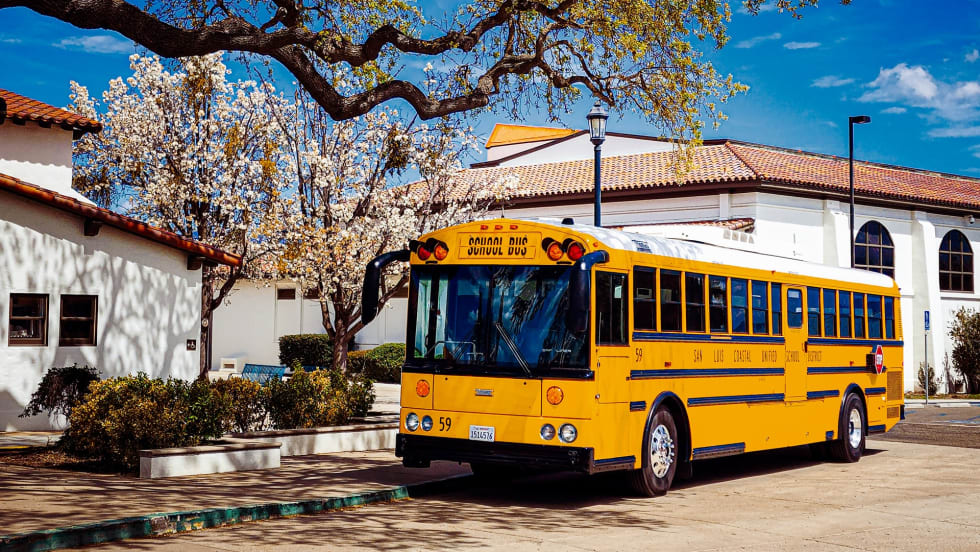
Where the Yellow Bus Takes Us: School Bus Fleet's 2026 Photo of the Year Winners
See the winning photos from School Bus Fleet's 2026 Photo of the Year contest, featuring stunning school bus images from across the U.S., from scenic landscapes to everyday moments.
Read More →
Why Emotional Intelligence Matters in Student Transportation
Learn the five key elements that bus drivers and transportation directors can use to stay calm in any situation.
Read More →
Sponsored•July 23, 2026
2026 Back-To-School Readiness Report
Staffing gaps, flat budgets, and the distance between “mostly prepared” and ready for the 2026-2027 school year.
Read More →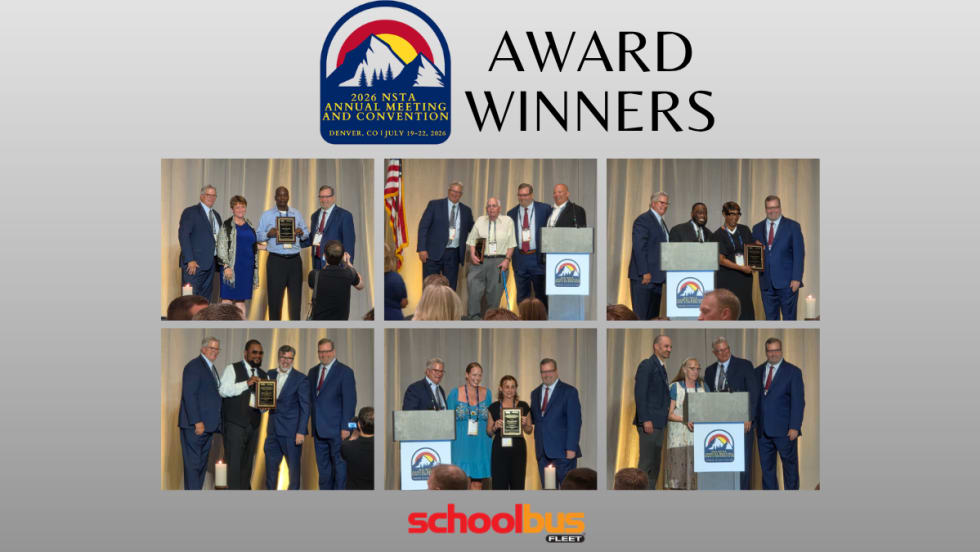
National School Transportation Association Presents 2026 Award Winners
Twenty-one individuals and contractor companies were recognized for excellence in student transportation at NSTA's annual meeting and convention in Denver.
Read More →
School Transportation Data Is Only as Powerful as the Story It Tells
Leaders say turning operational metrics into student-centered narratives can help districts justify investments and improve service.
Read More →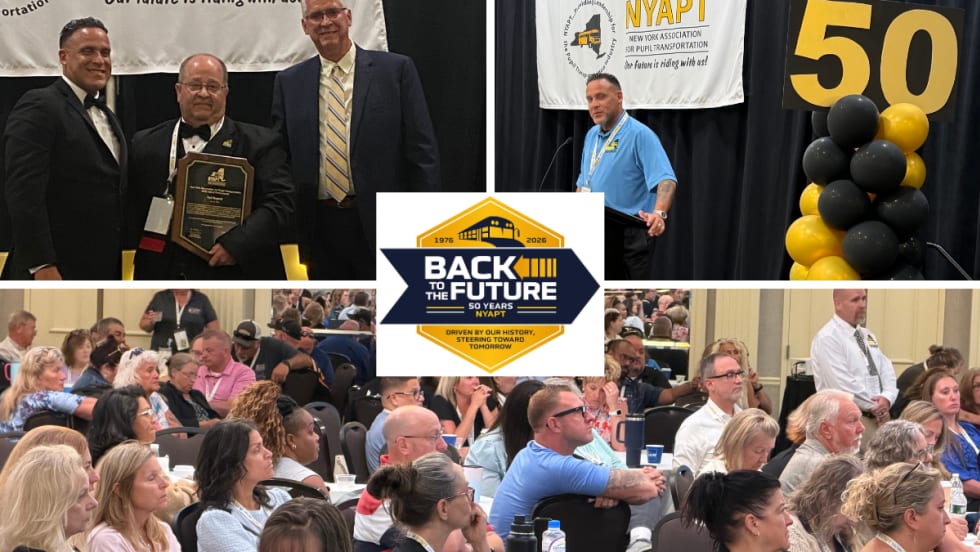
Photos: NYAPT Celebrates 50 Years at 2026 Conference & Trade Show
See highlights from NYAPT's 50th anniversary conference in Saratoga Springs, featuring educational sessions, awards, a trade show, networking, and more.
Read More →