

Key performance indicators — where to start?
Often, just by tracking and displaying results, employees become more aware of their own influence on the measurements.

In theory, almost everyone working in pupil transportation would agree that analyzing and understanding data is critical to managing operations. However, not every district has the same resources to develop and compare key performance indicators (KPIs).
During the National Association for Pupil Transportation (NAPT) Summit in October, the association’s KPI project was covered comprehensively, from a keynote speaker to several general sessions. A strong case was made for establishing industry-specific KPIs, which will allow school transportation directors to compare their operation to those of other school districts.
In one session, several school districts provided examples of transportation KPIs, many of which are tracked and reported to compare internal operations over time.
Keith Paulson of Anoka-Hennepin School District in Anoka, Minn., explained to the audience that his transportation department established KPIs as part of a district-wide initiative to measure and compare internal operations from one year to the next. Directors report KPIs on standardized vision cards or dashboards.
Smaller districts may not require their departments to report data on a vision card, but many track components to improve internal operations.
If you are a director in a small district with no history of using KPIs, where do you start? Telling your operational story requires a plot; you must decide what your plot will include.
Since gathering and analyzing data can be a daunting task, begin with something simple and easy to track. As Bill Bair of Colorado Springs (Colo.) School District 11 said, “It’s really just a matter of starting.”
Use your district’s existing vision, mission and goals to help determine your priorities. Most districts have a transportation vision statement sharing common terms. These include safety, reliability and efficiency. So start gathering internal data to establish a safety measure, a reliability measure and an efficiency measure.
1. Safety — number of accidents. Begin to record the number of accidents daily. Define accidents simply or in accordance with your state reporting definition. For instance, in Colorado, all accidents with more than $1,000 of damage must be reported to the Colorado Department of Education.
2. Reliability — number of road calls. Begin tracking the total number of road calls each day. First, define a road call — this could be as simple as tracking an interruption in service. Tally these daily; total them monthly and then annually. You now have a benchmark to compare with in the coming year.
3. Efficiency. Begin tracking the number of students riding the bus monthly. GPS programs make student tracking much easier, but even if you lack GPS, bus drivers can track actual ridership on a monthly basis. Pick the same day each month — for example, the first Tuesday of each month. Have each driver count the number of kids on the morning trip and the number on the afternoon trip. Divide the morning and afternoon total by two to establish an average.
Simple procedures can be used to track the data measures. Begin by using an Excel spreadsheet to input all monthly totals.
Once you begin tracking data, share the results with your staff. Often, just by tracking and displaying results, employees become more aware of their own influence on the measurements.
Just like with any new task, starting can be half the battle. Make this small step toward measuring three components, and you will have a wealth of knowledge to build upon in future years.
More Management
What Happens to a School Bus After Retirement? First Student Has a New Answer
Through a new partnership with Advanced Remarketing Services, proceeds from retired vehicle sales will support Special Olympics and other community-focused organizations while advancing sustainability goals.
Read More →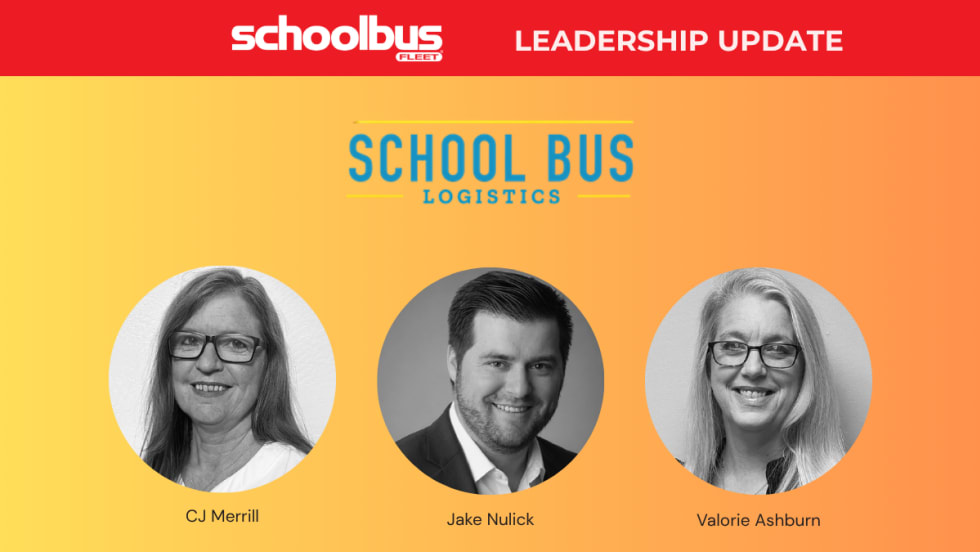
School Bus Logistics Adds 3 Data Analysts, Expands Routing Capabilities
Three new data analysts and a BusRight certification bring an added layer of support to the routing services districts already use.
Read More →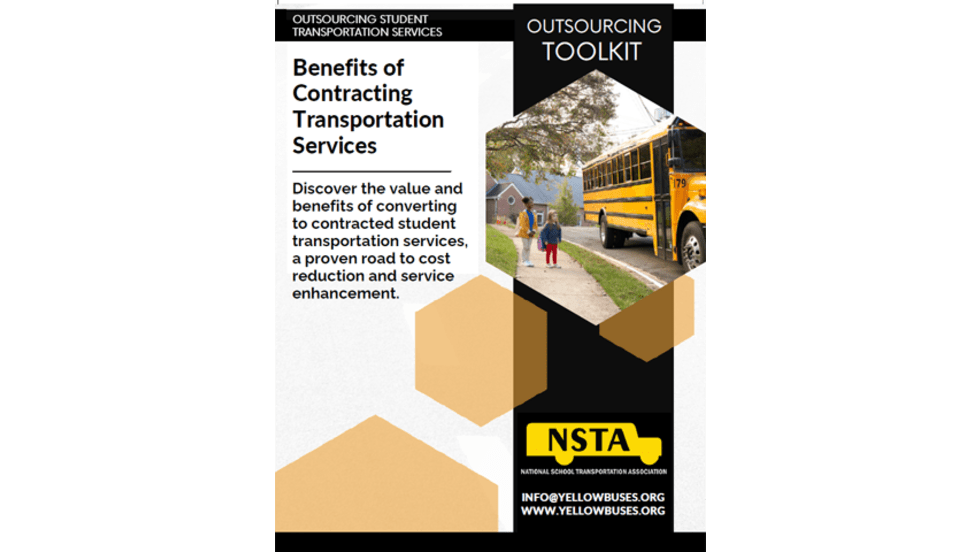
Outsourcing Student Transportation Services Toolkit
Did you know nearly 40% of school districts utilize a private contractor to serve their transportation needs? Explore why more school leaders are turning to contracted transportation services, and how outsourcing can create meaningful value without sacrificing control. Discover the practical benefits of a transportation services platform that provides flexibility with coordination.
Read More →


EverDriven Debuts TripCentral as New District Transportation Portal
The new transportation management hub takes over the district portal to power trip planning, operations, visibility, and intelligence for school district transportation needs.
Read More →
Lessons Learned from 4 Decades in Transportation: 5 Questions with Craig Beaver
Sit down with longtime transportation leader Craig Beaver moments before he retires, as he reflects on his career leading up to his role at Beaverton School District in Oregon and the secrets to leading great teams.
Read More →
BusRight Honors Texas Driver With Inaugural Behind The Wheel Award
Selected from more than 300 nominations, Lawson Crook earned BusRight’s inaugural award for his dedication to students and safety.
Read More →
Craig Beaver’s Final Stop: Lessons from 43 Years in Transportation
After more than four decades in transportation, retiring Beaverton School District director Craig Beaver reflects on leadership, alternative fuels, AI, staffing, and what’s coming next. The Route is sponsored by IC Bus.
Read More →
What 43 Years in Transportation Taught Craig Beaver About Leadership
After more than four decades in transportation, retiring Beaverton School District admin Craig Beaver reflects on leadership, alternative fuels, AI, staffing, and what’s coming next.
Read More →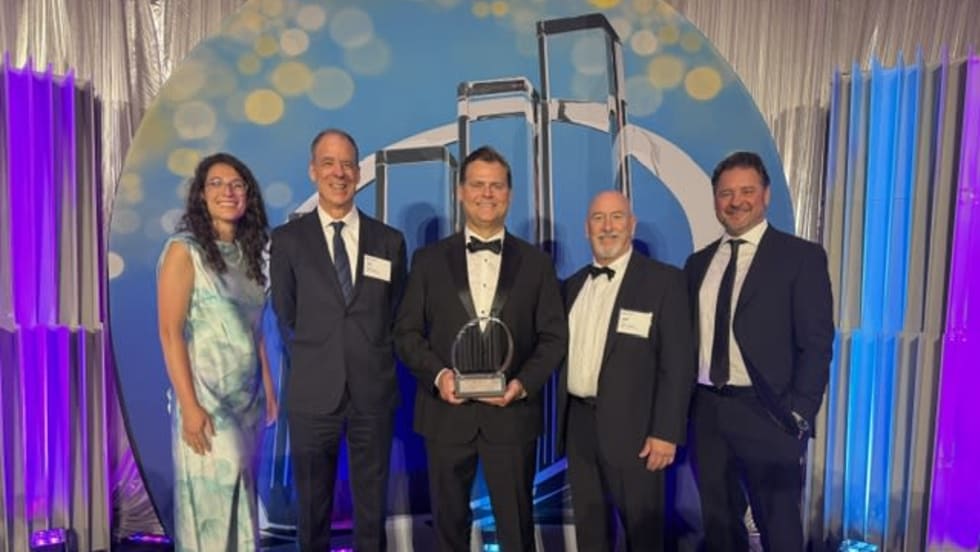
ASTP's Tod Eskra Named an Entrepreneur of the Year
The award from Ernst & Young honors visionary leadership behind one of America's fastest-growing student transportation contracting companies.
Read More →
Drivers and Technicians: Help Benchmark Today's School Bus Manufacturers
If you've spent time behind the wheel or under the hood, we want to hear your perspective on the buses you know best.
Read More →