

How to Reduce Your Accident Rate
Accident reduction programs are often implemented after there has been a devastating accident in the operation. To proactively attempt to reduce accid...
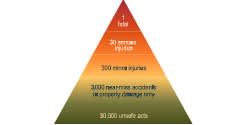
Accident reduction programs are often implemented after there has been a devastating accident in the operation. To proactively attempt to reduce accidents requires an understanding that a serious accident represents a much larger number of “minor” accidents, many more close calls and beyond that even more unsafe acts.
If you want to lower your rate of accidents, you must begin to identify and count these incremental indicators, not just hope you dodge the bullet and never have a serious accident. “Hope” and “prayer” are strategies used by many operators to escape having the “big one” — a student fatality — in their operation. While valid concepts, “hope” and “prayer” must be accompanied by action.
The historical safety pyramid model (above) relates unsafe acts to serious injuries and fatalities. The model suggests that it takes 1,000 unsafe acts to lead to a serious injury. Since only one in 1,000 unsafe acts actually has the concrete outcome of an injury, statistically counting only serious accidents is an unreliable indicator of the real safety of an operation. The numbers are simply too small to draw valid conclusions.
The inconsistency of statistical fluctuations is shown when an operation may have no accidents for two years and then three in two days. Another example is the 1993-94 school year in the loading-zone survey conducted annually by the Kansas State Board of Education. There were 32 loading-zone fatalities that year after five years with numbers from 16 to 22. Did that indicate a sudden 50 percent increase in poor school bus operation? No, the numbers came right back down — simply a statistical anomaly. Counting, evaluating and responding to unsafe acts and indicators, rather than serious accidents, then becomes the challenge to reduce accidents.
Even when the accident sample is large, such as a major national contractor or a large state, there can be radical random shifts in data from year to year. The National Highway Traffic Safety Administration uses 50,000 accidents each year to draw conclusions about injury-producing traffic accidents. To arrive at such a sample size for school buses would require all the school bus accidents in the country to be reviewed for more than five years. No operation can wait for 50,000 accidents in order to analyze trends with validity.
I’m assuming that the operator reading this article does a good job — that up-to-date transportation policy and procedures are in place and followed, training programs are designed to provide best-practice information to front-line staff and vehicles are properly spec’d and maintained. What this article will attempt to do for thoughtful readers is provide links and connections that help them use the staff expertise and information already available to make a significant impact on the long-term accident rate of an operation.
Create a safety culture
The real culture of an organization is generally unarticulated but is immediately apparent to all who join the operation. It is not what’s printed on plaques or jackets. The culture is demonstrated by how those in the organization “walk the walk.” An organization can do everything “by the book,” but still have a culture that actually encourages unsafe acts or negative attitudes toward safety.
Look at the case study in the sidebar on this page. What would the response be in your organization? Does your organization overlook safety issues when convenient? Does it seek to achieve safety by punishment? Or does it work collaboratively to impress safety priorities on all employees?
Think collaboratively
While the old camp song suggests, “It only takes a spark to get a fire going,” a single spark cannot maintain a fire, and one person alone cannot maintain a safety effort. You may need to be the spark that starts that effort, but it needs to “catch” on and include everyone in the organization.
The establishment of a safety committee is an important first step toward creating a forum for safety issues to be identified, analyzed and addressed. Plan to start by doing a lot of listening. Employees may be used to you doing a lot of preaching, and you have to persuade them this is different. It is best if participation is voluntary, not wage- or seniority-driven.
Another important collaborative function is accident review. While potentially more controversial than a safety committee, an accident review committee plays an important function in reviewing accidents and establishing preventability.
This review can address not just the specific accident, but also can identify training issues and policy or equipment recommendations. Operations that have established accident review committees find that they take their role very seriously and are, in fact, often more stringent in their analysis than a supervisor might be.
Perhaps the way that drivers, attendants and mechanics can best collaborate in the establishment of a safety culture is by becoming the eyes and ears of the organization. These individuals are on the road, at the schools and under the hood all day, every day. They see things that the manager might not see for weeks, months or never until an accident exposes a crack in the system — either physical or metaphorical. If these individuals’ concerns are listened to and addressed, they will continue to bring concerns to the office, allowing them to be dealt with before reaching the crisis stage.
{+PAGEBREAK+} Gather information
While I downplayed the relevance of small amounts of data for accurate trend analysis, I certainly don’t suggest that data collection is unimportant. But because the value of data increases with the volume of data, find ways to count things that give you meaningful trends. For instance, if you count all the serious-injury, stop-sign accidents in your operation to determine if there is a problem with negotiating stop signs, there could be a number of people hurt before you decide to suggest retraining in that area. If you review the annual driver observations and see that 20 percent of your drivers do not negotiate stop signs properly, you could implement retraining before any accidents occur.
There are many streams of data coming into the transportation office. Each has a story to tell if you look closely. Parts purchases could suggest poor equipment choices or bad driving habits. Fuel economy can suggest engine problems or poor driving habits. Phone logs can indicate poor interpersonal skills or bad driving habits. Poor bus inspection pass rates or excessive road calls can suggest poor preventive maintenance. Student discipline reports can indicate whether drivers are working well with students and administrators. Onboard video gives you a perspective of exactly what is happening on the bus. Driver observations and annual driver record checks can be indicators of driving habits on and off the job. Old-fashioned tachographs told us something about driving habits and idling time; new computerized data-gathering systems can tell you about light and signal use, turns, braking and GPS location and can provide streaming video from the buses.
Analyze data
As human beings, we naturally analyze data; we make informal assumptions and draw conclusions. In workshop settings, I have asked the participants if they could name one individual in their operation who was “an accident waiting to happen.” Invariably, at least 75 percent of the people raised their hand. (Others were just hesitant to admit it.)
The question I then ask is, “Why are you still waiting?” Do something about it. Some of our employees may have some pretty obvious flaws, either in skills or attitude, but other safety gaps may be less obvious. Only when you start to analyze the data streams mentioned above do less obvious trends become exposed. Remember, the larger the dataset, the better you can identify trends. If you look at accidents, look at all accidents, even those as “minor” as a broken mirror. If you want to evaluate driving skills deficits, sit down with your annual driver observation forms for the fleet (better yet, use multiple years) and quantify what specific problem areas you have. You will be surprised at how very specific concerns arise.
Use common sense in determining what constitutes a trend, but don’t just make decisions by the seat of your pants. If you have five parent complaints about one driver and one for another, the first driver likely has a communication problem. But if all five are from the same parent, and every driver who has ever driven that parent’s child has had similar complaints lodged, you know that the driver needs support more than retraining.
As you and your organizational groups analyze incidents and datasets for preventability and retraining needs, be sure that the discussion does not always start with, “What did the driver do wrong?” Remember that there can be system flaws that put drivers or others in a bind where correct procedure is almost impossible. Is the gate to the yard too narrow? Is the blind spot on the new buses too big? Can the lap-shoulder belt on the wheelchair really be used for a child that small? Do you have the equipment to complete that repair properly? Is that point on their route out of radio range? Does the computer routing system put too many children on the bus to complete the run without rushing? Analyze these things, too.
Set goals, rewards
Goals can hang over one’s head as a guillotine or motivate one to excellence. It all depends on how the goals are set, and what the consequences are for achieving or not achieving the goals. Are winners applauded by all, or do they lord it over their peers? Are losers encouraged and given the skills necessary to be successful next time, or are they discouraged from trying again? If the winning team gets $200 each, the losers won’t be very happy. If the winners get a preferred parking spot, there will be some good-natured ribbing but not antagonism. You can set fleet goals, like 5 percent improvement in fuel economy, or create teams that compete against each other to achieve goals.
When tracking data, make it accessible to drivers, attendants and mechanics so they can track their progress and achievements. Try to create a setting for positive competition so that everyone wins.
Positive consequences or rewards may not have a place in your budget, so you might have to undertake some cost-benefit analysis in order to create budget room. Let’s start with a simple one. If your fuel mileage increases 5 percent, then 5 percent of your fuel budget will probably buy some pretty nice jackets for your staff. If the number of citations your drivers have in their own cars and in buses decreases, you will probably also be reducing your accident rate and possibly your insurance rates. Go ahead and spend your savings on taking the whole crew out to a movie some night.
Require accountability
Competitions and goal achievement can be fun, increasing performance as well as job satisfaction, but there are also times when change may not be fun and uplifting, but necessary. This is particularly true of an individual who demonstrates specific deficits — the “accident waiting to happen.” The changes that this individual must make must be clearly stated as objective measures by which he or she will be judged. If you tell a driver, “If you have another accident, you are out of here,” remember that the next accident could be the “big one.” Better to do weekly road observations for a month with feedback each time. If driving skills do not improve, perhaps you can move that employee out from behind the wheel before experiencing a tragedy in your district.
Summary
Successful accident-reduction strategy is really an accident-producing-situation reduction strategy. We know that accidents happen in accident-producing situations, but whether the accident will happen or not is random — we must simply work to reduce the number of situations.
We can identify the presence of accident-producing situations by reviewing many data streams: driver observations, garage reports, complaints and fuel usage. By reducing the presence of accident-producing situations, we know that, ultimately, we will also be reducing accidents. Work collaboratively with front-line staff to analyze data, identify areas for improvement and to set goals. You might find that in addition to reducing accidents your collaborative effort may also decrease staff turnover, extend vehicle life and create a positive public image of your district and operation.
Ted Finlayson-Schueler is executive director of the Pupil Transportation Safety Institute in Syracuse, N.Y. For more information, visit www.ptsi.org or call (800) 836-2210.
More Safety
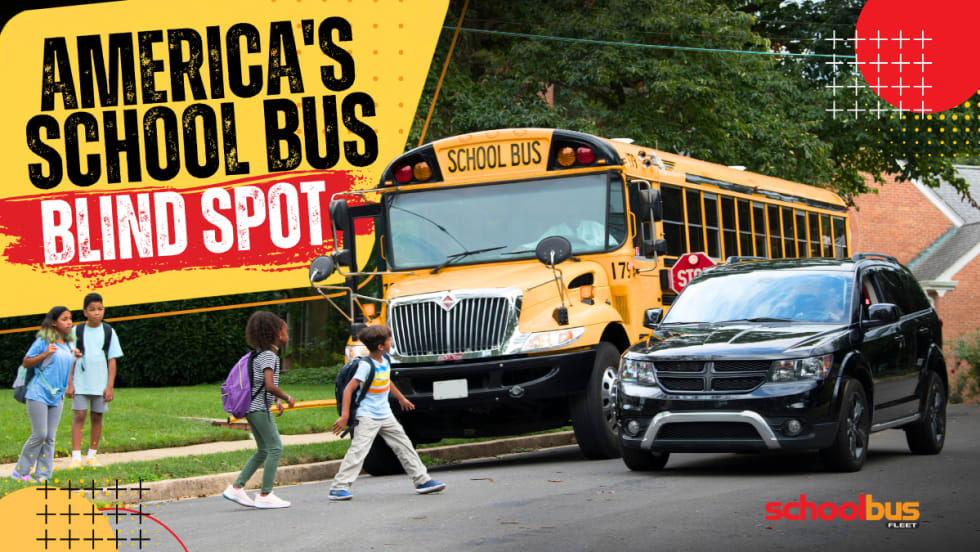
America Has a School Bus Passing Problem — and Distraction Is Making It Worse
Illegal school bus passing remains a major safety threat as distracted driving rises. This op-ed explores why awareness, enforcement, and stop-arm cameras matter more than ever.
Read More →
School Bus Laws to Watch: New York Delays EV Mandate
Plus, federal lawmakers seek new funding for school bus safety as states weigh stop-arm enforcement, disability protections, and education spending.
Read More →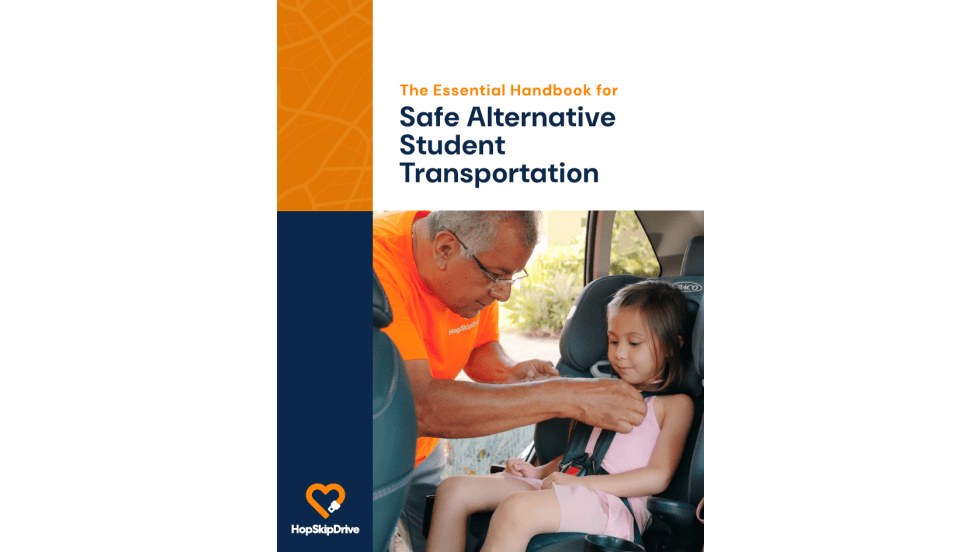
The Essential Handbook for Safe Alternative Student Transportation
Your district's "exception riders" — students with IEPs, those experiencing homelessness, foster care youth — deserve more than a middleman solution. This handbook breaks down exactly what to look for in a supplemental transportation partner: from driver vetting and regulatory compliance to proactive safety technology. Because getting a ride isn't the same as getting a safe one.
Read More →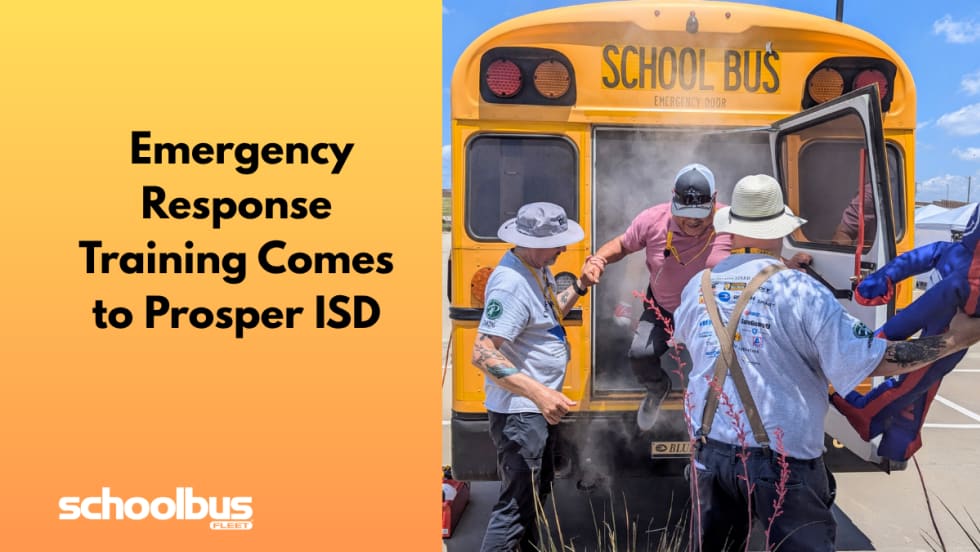
Operation STEER Brings Emergency Response Training to North Texas
Prosper ISD hosted the third annual training for transportation professionals across 67 districts to learn how to respond to emergencies, such as rollovers and evacuations, and proper use of safety equipment.
Read More →
Florida District Relaunches BusPatrol School Bus Camera Program With New Safeguards
After being suspended over due process concerns, Miami-Dade schools and law enforcement are restarting the AI-powered stop-arm camera program with new oversight.
Read More →
School Bus Laws To Watch: Seat Belt Bills, Funding Fights & EV Changes
From national bills on seat belts and driver oversight to driver awareness campaigns referencing “Finn’s Rule” and ongoing transportation funding debates in Alaska, here’s the latest in school bus legislation across the U.S.
Read More →
9-Year-Old Boy Killed by School Bus at Busy Brooklyn Intersection
A Williamsburg community is mourning after a child was fatally struck by a private yeshiva bus, prompting calls for urgent safety improvements at the high-traffic crossing.
Read More →
Does Reliable School Transportation Boost Attendance? EverDriven’s Data Says Yes
The new data shows 99.99% incident-free trips and strong on-time performance, reinforcing how dependable transportation, especially for vulnerable student populations, can help districts combat chronic absenteeism.
Read More →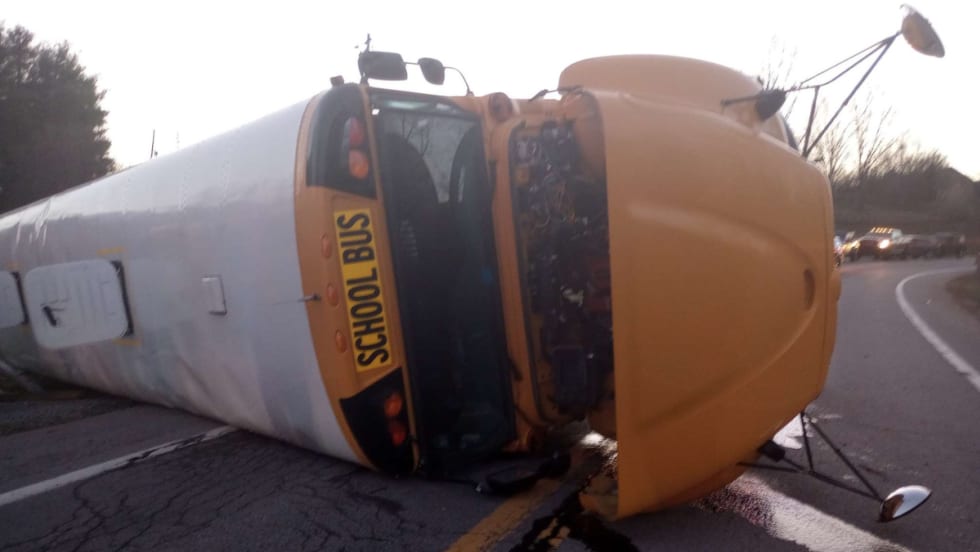
NTSB Calls for Alcohol Impairment Systems, Seat Belts After W.V. Crash Investigation
The federal agency's report asks NHTSA to require all new school buses to be equipped with vehicle-integrated alcohol detection systems and passenger lap-shoulder belts.
Read More →
2026 State of Student Transportation Report
Student transportation teams are being asked to do more with less, facing driver shortages, rising costs, and increasing safety expectations. This report uncovers how fleets are adapting, where technology is making the biggest impact, and why student ridership tracking is emerging as a top priority. Download the report to explore the key trends shaping 2026 and what they mean for your operation.
Read More →