


Last Year's Results: Special-Needs Ridership on the Rise [2024 Survey Results]
Driver Shortage Remains No. 1 Challenge for Special-Needs Transportation [2025 Survey Report]
What’s changing in special-needs transportation? Check out what this year’s survey data tells us about staffing and pay, tech adoption, fleet makeup, and more. This survey is sponsored by AMF Bruns of America.
January 20, 2025
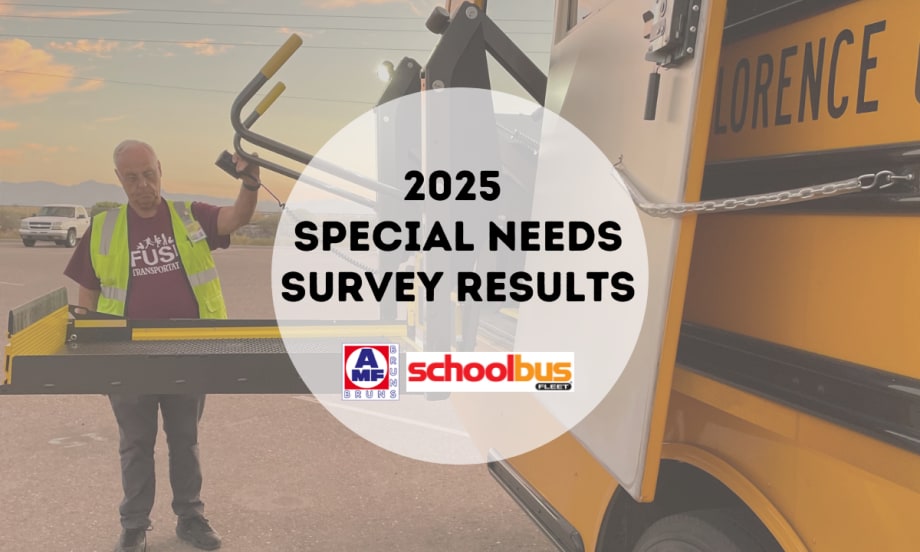
One of the Florence Unified School District staff conducts a pre-trip of the special needs lift functions on the bus.
Photo: Florence Unified School District #1 | SBF/Canva
3 min to read
The special-needs transportation landscape is growing and evolving, and this year’s survey brings a nuanced look at the shifting trends. While anecdotal conversations point to an increase in special-needs riders, the data tells a slightly different story.
As more students are mainstreamed, there’s also a decline in the use of Type A and B buses in fleets. Driver pay, too, is flattening, with more special-needs drivers earning the same as general-ed route drivers. More aides are on board special-needs buses than last year, likely reflecting the trend of the driver and aide shortage beginning to slow. Encouragingly, the impacts of the supply chain and OEM delays are stabilizing as we get closer to normal.
Meanwhile, tech adoption grows, as more operators began using video cameras on buses and child-check systems; however, rider tracking system use declined.
Of course, challenges remain, with the driver shortage still ranked as the top transportation issue. New concerns, such as accommodating changing and inconsistent dismissal times and the increasing complexity of transporting out-of-district students, gained prominence.
For reference, most survey respondents this year (54%) had small fleets with fewer than 50 total buses, though the average fleet size was 120.
All data presented was compiled and averaged from about 160 qualified survey respondents, including transportation staff at districts and contractors, from December 2024 to early January 2025.
Please note: Our data analysis process has recently changed, so some data in past years may appear skewed as we work to ensure accurate industry reporting.
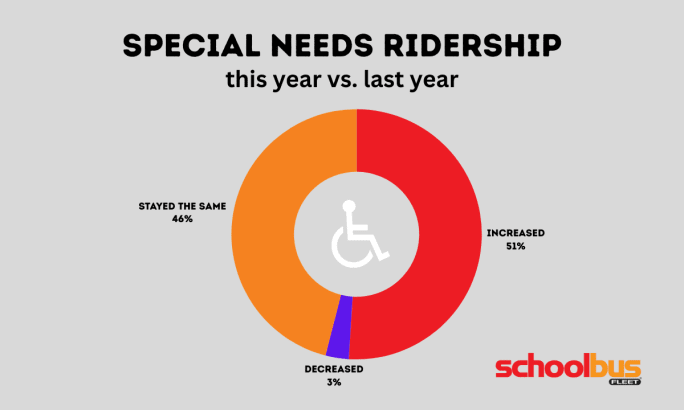
Is the trend finally stabilizing? In 2024’s survey, 59% reported an increase in special needs passengers, and 39% reported the same. While these responses show the strain slowing, most directors anecdotally expressed that they’re still seeing an upward trend in accommodations needed.
Source: SBF
2025 Special Needs Survey Takeaways
Average percentage of buses in fleet primarily transporting special-needs students:15%
Average percentage of riders with special needs: 21%
Average percentage of special-needs riders who use a wheelchair: 8%
Average percentage of school-to-home special-needs bus stops: 90%
Special-needs drivers generally (93%) have the same pay rate as general-education drivers. This year, pay was the most equitable since 2021, with a jump from last year’s 88%!
Over half of operators (57.8%) reported having aides/attendants on board all their special-needs buses — up from last year’s results of 49%. Fewer special-needs buses are left with no aides this year (11.9%), compared to last year’s 16%.
More students are being mainstreamed, with 81% this year — compared to 79% in total last year.
The supply chain strain is loosening its grip, with more operators reporting no problems and fewer reporting any. In total, 49% of this year’s respondents were impacted, down from last year’s 57%.
Type C and Type A school buses remain the top choices for transporting special-needs students.
Adoption of electronic systems to remind drivers to check for students after ending their route has increased. Last year, 27% of respondents were not using any system; this year dropped to 14%.
Most (96%) operators have at least some special-needs buses equipped with video surveillance — up from 2% from last year.
More than three-quarters of operations surveyed have special-needs buses equipped with air-conditioning systems — about the same rate as last year.
Most operations (86%) don’t use an electronic ridership tracking system for special-needs riders, according to survey responses.
Nearly three-quarters (72%) of operators have experienced small or large impacts from the nationwide driver shortage on special-needs routes, about the same as last year.
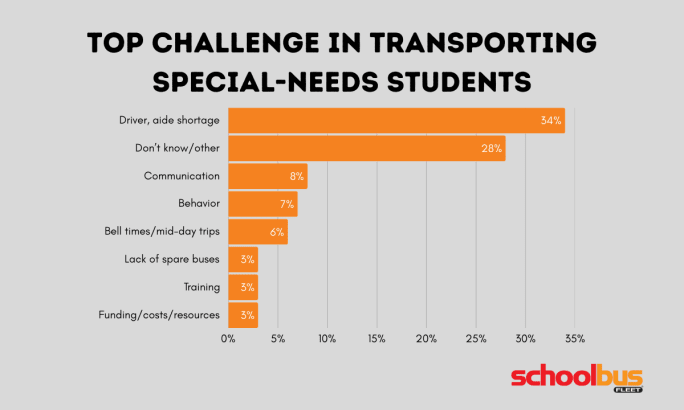
Most respondents said the driver and aide shortage remained their biggest pain point this year (again), though 4% fewer than last year. Transportation outside district zones rose 4% from last year. Some of the “other” challenges noted included time, scheduling, evacuation planning, district growth, and the increase in special needs students.
Source: SBF
Most common vans used for special-needs transport
Ford Transit
Dodge Caravan
Chevrolet Express & Suburbans
Subscribe to Our Newsletter
More Special Needs Transportation
HopSkipDrive Launches New Safety, Driver Consistency Features for 2026-27 School Year
The company’s free ride recording, live ride tracking, and consistent driver assignments aim to improve safety and continuity for diverse student transportation needs.
Read More →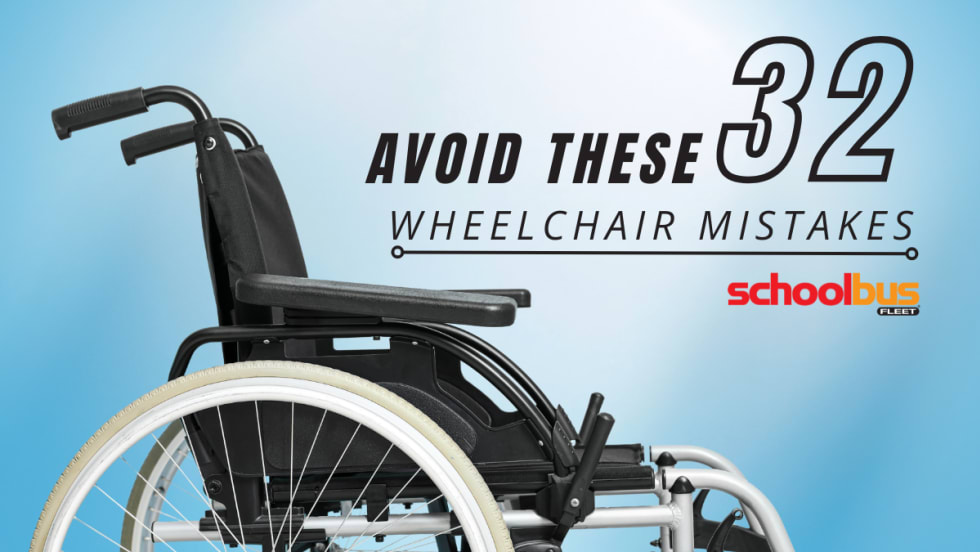
The Most Common Wheelchair Securement Mistakes on School Buses (and How to Fix Them)
Small missteps in wheelchair securement can have serious consequences. Here are 32 tips from experts to reduce risk and increase student safety on the bus.
Read More →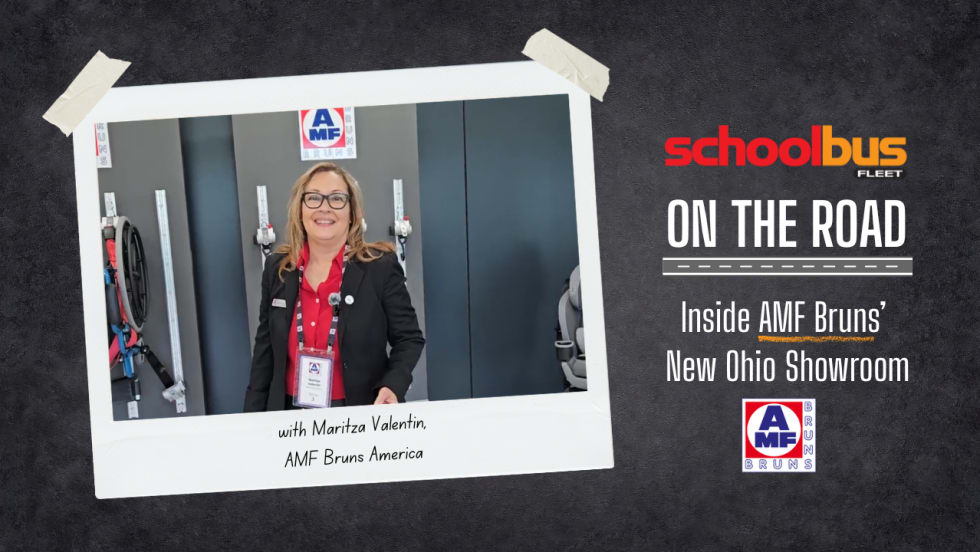
Inside AMF Bruns’ New Showroom: School Bus Securement Solutions Explained
Go inside AMF Bruns America’s new Ohio showroom with Maritza Valentin to see its FutureSafe technology, driver training tools, securement systems, and seating innovations.
Read More →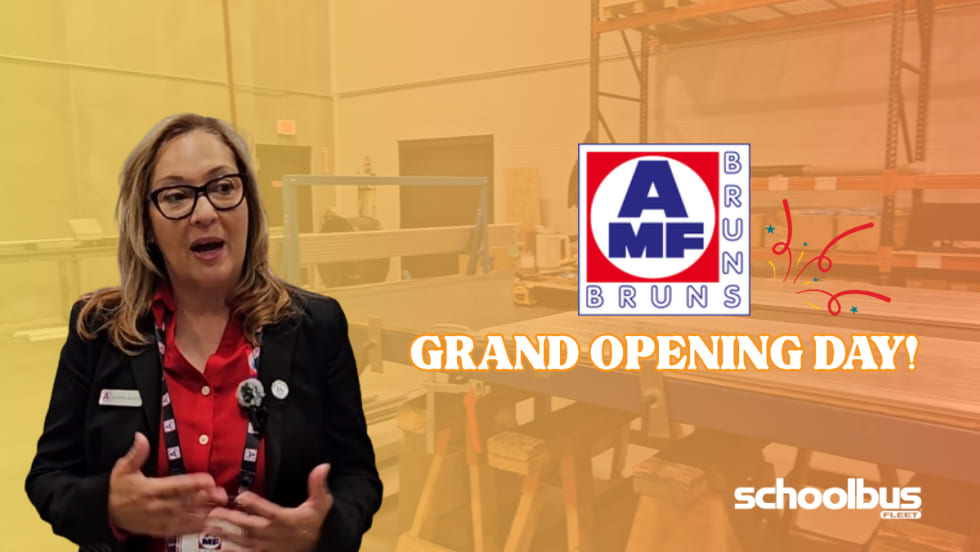
What AMF Bruns’ New Facility Means for Customers [Video]
Inside AMF Bruns’ new Stow, Ohio, operations: See how expanded space and innovation will enhance customer support and operations.
Read More →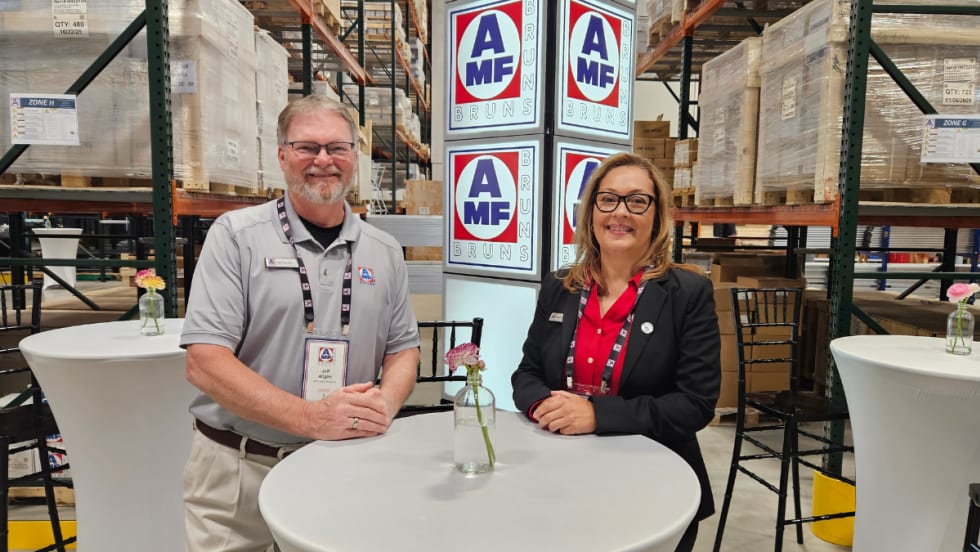
AMF Bruns Expands in Ohio, Investing in Growth and Community
With expanded production space, local investment, and a growing workforce, AMF Bruns is scaling its U.S. presence. Here’s an exclusive first look inside the new Stow, Ohio, HQ.
Read More →
Inside AMF Bruns of America’s New Ohio Manufacturing Facility [Photos]
Take a behind-the-scenes look at AMF Bruns of America’s new 41,000-square-foot Stow, Ohio, headquarters, featuring advanced manufacturing, expanded space, and future-ready mobility solutions.
Read More →
First Student Boosts Student Support in Wichita & Texas
First Student and Wichita Public Schools are using behavioral support strategies to improve student ride experiences, while a separate initiative expands access to after-school programs through a bus donation.
Read More →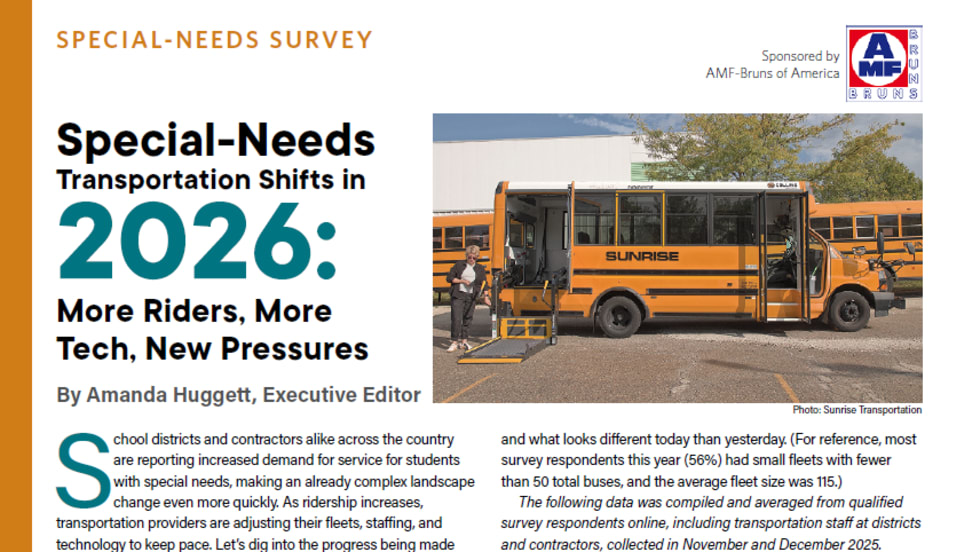
2026 Special-Needs Transportation Survey
What’s changing in special-needs transportation? This year, student transportation operators report a rising need, easing driver shortages, growing tech adoption, and evolving challenges. Sponsored by AMF Bruns of America.
Read More →
The Lived-Experience Gap in Mobility Tech: An Expert Take on Safe Student Transportation
Brianna Pauwee, a product application specialist at AMF Bruns of America and a wheelchair user, drops in to The Route to share practical securement and training insights, plus the story behind the new “Beyond Mobility” podcast. The Route is sponsored by IC Bus.
Read More →
Sponsored•February 11, 2026
What Transportation Gets Wrong About Wheelchair Securement (And How to Fix It)
Brianna Pauwee, product application specialist at AMF Bruns of America and a wheelchair user shares practical securement and training insights, plus why she launched the “Beyond Mobility” podcast. The Route is sponsored by IC Bus.
Read More →