


Report Ranks Best, Worst, Safest, and Most Expensive State Highway Systems
The Reason Foundation’s Annual Highway Report finds that North Dakota and Kansas have the nation’s most cost-effective highway systems, while New Jersey and Rhode Island have the worst.

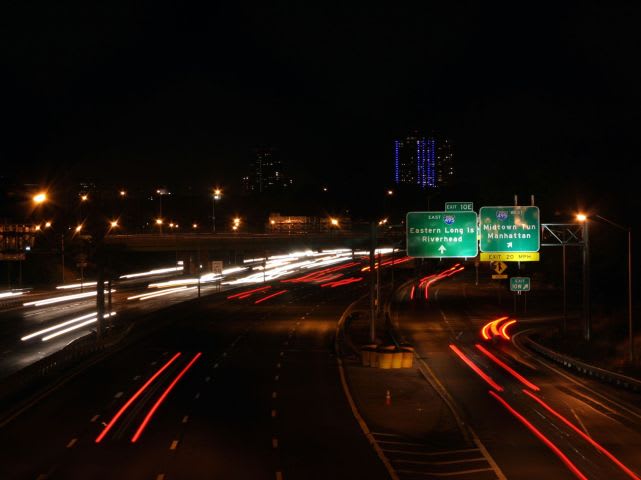
The Reason Foundation’s Annual Highway Report ranks the performance of state highway systems in 11 categories, including spending per mile and traffic congestion. Photo by Barry Johnson

The Reason Foundation’s Annual Highway Report ranks the performance of state highway systems in 11 categories, including spending per mile and traffic congestion. Photo by Barry Johnson
The nation’s top-performing, most cost-effective highways can be found in North Dakota, Kansas, South Dakota, Nebraska, and South Carolina, according to a new study.
The 23rd edition of the Reason Foundation’s Annual Highway Report, released on Thursday, ranks the performance of state highway systems in 11 categories, including pavement condition, deficient bridges, traffic congestion, fatality rates, spending per mile of state-controlled highway, and system administrative costs.
According to the Reason Foundation, the significant differences between state highway systems were illustrated by the huge disparity in spending per mile. West Virginia spent the least — $35,047 per mile of state-controlled highway — while New Jersey spent the most — $2,069,020 per mile of state-controlled highway.
Overall, New Jersey ranked last, 50th, in the nation in performance and cost-effectiveness — reportedly due in part to having the nation’s worst urban traffic congestion — while also spending the most money per mile. Rhode Island, Alaska, Hawaii, and Connecticut joined New Jersey in the bottom five of the overall rankings.
In some of the individual categories, Massachusetts’ highways had the country’s lowest fatality rate, while South Carolina’s had the highest. Wyoming’s highways had the least traffic congestion, whereas drivers in New Jersey and California experienced the worst traffic jams. Alaska had the bumpiest urban interstate pavement condition, and Delaware had the smoothest.
This edition of the Reason Foundation’s Annual Highway Report is based on spending and performance data that state highway agencies submitted to the federal government for the year 2015, the most recent year with complete data available.
The overall cost-effectiveness rankings are below. Detailed information about each state’s results, as well as each of the categories, is available here.
State Highways: Overall Performance and Cost-Effectiveness Rankings
1. North Dakota
2. Kansas
3. South Dakota
4. Nebraska
5. South Carolina
6. Montana
7. Idaho
8. Wyoming
9. Missouri
10. Utah
11. Mississippi
12. Tennessee
13. Kentucky
14. North Carolina
15. Iowa
16. Arizona
17. Alabama
18. Georgia
19. Delaware
20. Nevada
21. Oregon
22. Texas
23. Maine
24. New Mexico
25. Minnesota
26. Ohio
27. Virginia
28. Illinois
29. Arkansas
30. New Hampshire
31. Colorado
32. Michigan
33. Oklahoma
34. Indiana
35. Florida
36. West Virginia
37. Louisiana
38. Wisconsin
39. Vermont
40. Maryland
41. Pennsylvania
42. California
43. Washington
44. Massachusetts
45. New York
46. Connecticut
47. Hawaii
48. Alaska
49. Rhode Island
50. New Jersey
More Management

Nominate Rising School Transportation Pros Under 40!
We’re searching for the next generation of leaders making an impact across the K-12 student transportation industry to recognize as SBF’s 2027 Trailblazers. Nominations are open now!
Read More →
Changing Lanes: BusWhere, EverDriven, InterMotive, Summit School Services, Switzer-Carty & Thomas Built Buses
Check out who's been hired, promoted, and appointed to leadership positions at various school transportation suppliers, contractors, and manufacturers.
Read More →
The Most Expensive Thing You Do Before Selling a School Bus: Wait
When should you sell an aging school bus? Learn how maintenance, mileage, corrosion, specifications, and timing can affect resale value long before the auction.
Read More →
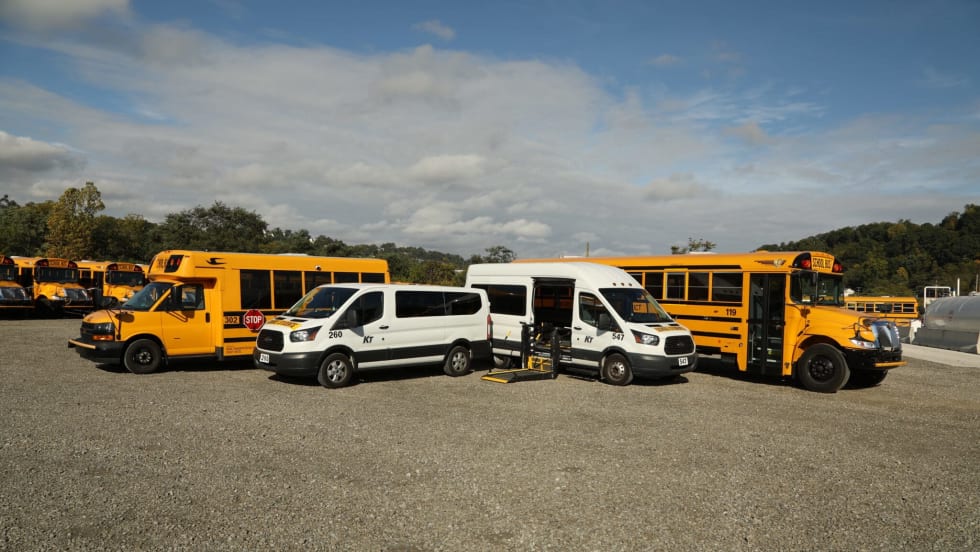
American Student Transportation Partners Acquires AJ Myers and Sons
A new deal brings a 75-year Pennsylvania student transportation provider into one of the nation’s largest private school bus contracting groups.
Read More →
What I Brought Home From SBFX: Relationships, Leadership, and Preparing What's Next
Who could lead your transportation operation tomorrow if you couldn't? Bernando Brown explores succession planning, mentorship, and preparing emerging leaders to step up.
Read More →
Inside School Bus Fleet ConneX 2026: Industry Leaders Connect in Scottsdale [Photos]
See highlights from SBFX 2026 in Arizona, where school bus operators and suppliers gathered for meetings, education, networking, awards, and more.
Read More →
School Transportation’s Biggest Pressures and Opportunities: SBFX Attendees Weigh In
School bus operators point to rising costs, staffing, and vehicle prices as immediate pressures while identifying technology, training, and routing as opportunities for growth.
Read More →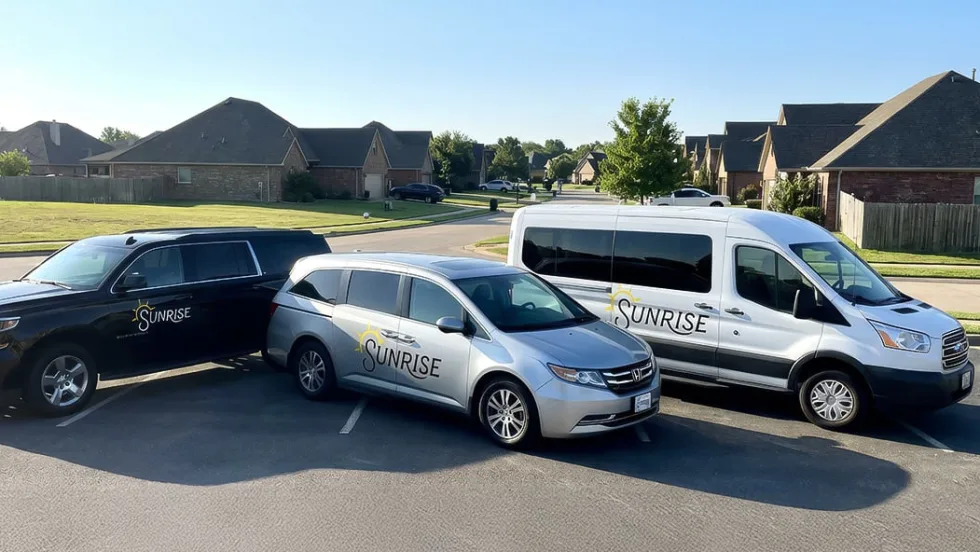
STA Acquires Sunrise Transportation
Student Transportation of America expands in Illinois and Connecticut through Sunrise's fleet of nearly 1,000 vehicles.
Read More →
EPA Opens $180M DERA Funding Round for Diesel Upgrades
The 2026 Diesel Emissions Reduction Act program seeks applications from eligible organizations to accelerate the retirement of legacy diesel vehicles.
Read More →
HopSkipDrive’s CareEngine Targets the ‘Exceptions’ in Student Transportation
The new platform works alongside districts’ existing transportation management systems to coordinate specialized rides, automate last-minute changes, and turn ride data into operational improvements.
Read More →