

5 Steps to Successful Data-Driven Decision-Making
Collaborating to identify actionable data, creating common access, and establishing a system to organize it are some of the steps Toledo (Ohio) Public Schools took to achieve more efficient decision-making.
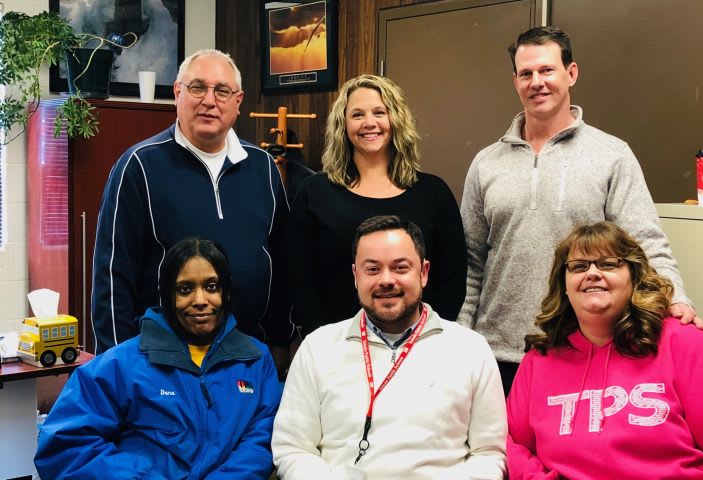
Toledo Public Schools transportation team members, shown here, worked together to identify and organize actionable data using a five-step process. Brad Aemisegger, director of transportation, is pictured far left in the top row.

Like a lot of places these days, Toledo (Ohio) Public Schools (TPS) is a data-driven organization. Our transportation department, for example, has lots of data, which is collected by and auto-generated from a GPS system, a routing system, a maintenance work order system, a fuel system, and a new time clock and payroll system. In fact, we had so much data it was overwhelming.
Stepping back from the daily fray, we saw how challenging it was for our team to effectively and efficiently utilize our data, and realized it was time for a change.
After a series of inter-departmental brainstorming sessions, the transportation department went through the following five-step process that has significantly changed the way we use data today.
Step 1: Creating personal visions of success and articulating the role data plays in the vision
Success is collaborative. Through a series of facilitated one-on-one sessions, each supervisor and manager developed a vision of success for themselves and their functional area. Each of them then defined how they would measure their success and what it would look like. They then articulated the changes that were required. Finally, they identifed the data needed to track progress and then determined if that data was available. If not, we had to figure out how to collect it.
We had a group discussion among our supervisors to ensure everyone’s individual vision was aligned to the overall department vision. The importance of creating a sense of ownership in the future of the department cannot be understated. The passion for being a part of a collective success opened the door for supervisors to utilize their potential and proactively generate the required changes.
When we asked participants “On a scale of 1 to 10, with 1 being ‘not at all,’ and 10 being ‘at the max,’ to what extent does TPS utilize your potential?” Before this effort started, the scores were in the 4 to 5 range. Today, the scores are in the 8 to 9 range.
Step 2: Creating user-based metrics and dashboards
There is a virtual “buffet” of data in a transportation department generated from all the software and systems. TPS wanted to be proactive about using and managing that data. So, the department went from a “buffet” mentality to one where the supervisors and managers created their own “data menu” for their functional areas.
Again, in facilitated one-on-one sessions, each manager and supervisor started with their vision and definition of success, and determined the metrics for how they could measure it. This was a new and challenging activity that reinforced the team’s sense of ownership. New metrics were created that required new configurations of data, new calculations, and a new infrastructure to collect and store that data and generate the dashboards.
Since TPS uses a Google platform in the IT department, we used Google Drive and Google Forms to collect and generate the data, which is stored on Google Sheets. Simple dashboards are generated by the default capability within the Google platform. More complex dashboards required the use of pivot tables in conjunction with Google Sheets. All forms are easy to use and store the needed data to generate performance dashboards that the managers and supervisors design and use at targeted intervals. Every data point is selected by the managers and supervisors, and the Google templates enable the form to be adjusted as needed, making the whole system agile.
A partial list of processes and areas that have been the core focus of the management team include: safety, vehicle breakdowns, driver and bus aide evaluations, routing team activity, mechanic work order management, customer service, training activity, route book compliance, and driver time and attendance. As the team gets comfortable with using data tools and methods, they plan on adding activities and processes to track.
Step 3: Establishing collaborative data, performance transparency
The department vision requires teamwork, and thus, no “silos.” That included no data silos, which was another significant change.
The department uses Google Drive as the data repository, and has provided access to all templates and dashboards to all managers and supervisors. This increases overall efficiency. Rather than ask for and then wait to receive data, everyone can simply look things up. For example, if the training supervisor is preparing for or wants to track the impact of a workshop, he or she can review the safety dashboard to print data for the session or to track any variances in safety performance.
Common access can also stimulate innovation and new ideas. Often the issue in one functional area is caused and can be resolved in another area. For example, an analysis of the causes of vehicle breakdowns identified driver error and delayed part replacement as key issues. That led to changes in the preventive maintenance process, as well as it being a topic in driver review meetings. The result was an 80% drop in vehicle breakdowns.

Step 4: Launching a Kaizen-style data management program to standardize data organization
Data organization surfaced as an issue; each supervisor had their own process and structure for creating folders and files on the system. We therefore needed to measure how long it took one supervisor or manager to find something in another’s data filing system. Then, we needed to create guidelines and a process for setting up data files. To do this, we borrowed from Kaizen methodology.
Workplace organization, continuous improvement, and reducing variation are three key elements of Kaizen. We applied them to data management to establish “data rules” that were equivalent to workplace organization, so that the data hierarchy and folders were organized in a similar fashion.
Step 5: Creating a meeting agenda that requires the use of the data
This was a really important step. To ensure that we were using data to our maximum benefit, we had to create a new format for our meetings. Now, every TPS transportation meeting goes like this:
- Every supervisor and manager has 5 minutes to share their key dashboards, showcase accomplishments, highlight areas for improvement, and indicate where performance recovery or remedial action is required.
- In every meeting, one manager or supervisor has 15 minutes to do a deeper dive to show all dashboards and trend data. In this longer session, root causes of issues are reviewed as they could be in another functional area, which fosters collaborative planning and action.
At TPS, we believe firmly in the business value of data. It can uncover problem areas and help make informed decisions. However, after going through this process, we realize more than data is needed to make the best decisions. You need good people. Thankfully, that’s what we have at TPS.
About the Authors: Brad Aemisegger is the director of transportation at Toledo Public Schools. James P. Regan is the managing partner of Capitalworks, a business analytics firm.
More Management

Changing Lanes: AMF Bruns, Pro-Vision, CALSTART, HopSkipDrive, & Kooner
Check out who's been hired, promoted, and appointed to leadership positions at various school transportation industry suppliers and nonprofits.
Read More →
NCST Announces 18th Congress Event Dates, New Committees
The National Congress on School Transportation moves to St. Louis in May 2029, convening delegates and industry representatives to discuss new best practice recommendations. Now, the new committee chairs have been named.
Read More →
Key Moments from the 2026 NSTA Annual Meeting in the Mile High City
From federal policy updates and OEM presentations to speed networking and industry awards, see photos and highlights from the contractor association’s summer conference in Denver.
Read More →

HopSkipDrive Launches Spanish-Language App Update, Plans Additional Language Support
The update aims to improve communication with multilingual families by offering ride tracking, notifications, and support in Spanish, with more languages planned for the 2026-2027 school year.
Read More →
Where the Yellow Bus Takes Us: School Bus Fleet's 2026 Photo of the Year Winners
See the winning photos from School Bus Fleet's 2026 Photo of the Year contest, featuring stunning school bus images from across the U.S., from scenic landscapes to everyday moments.
Read More →
Why Emotional Intelligence Matters in Student Transportation
Learn the five key elements that bus drivers and transportation directors can use to stay calm in any situation.
Read More →
2026 Back-To-School Readiness Report
Staffing gaps, flat budgets, and the distance between “mostly prepared” and ready for the 2026-2027 school year.
Read More →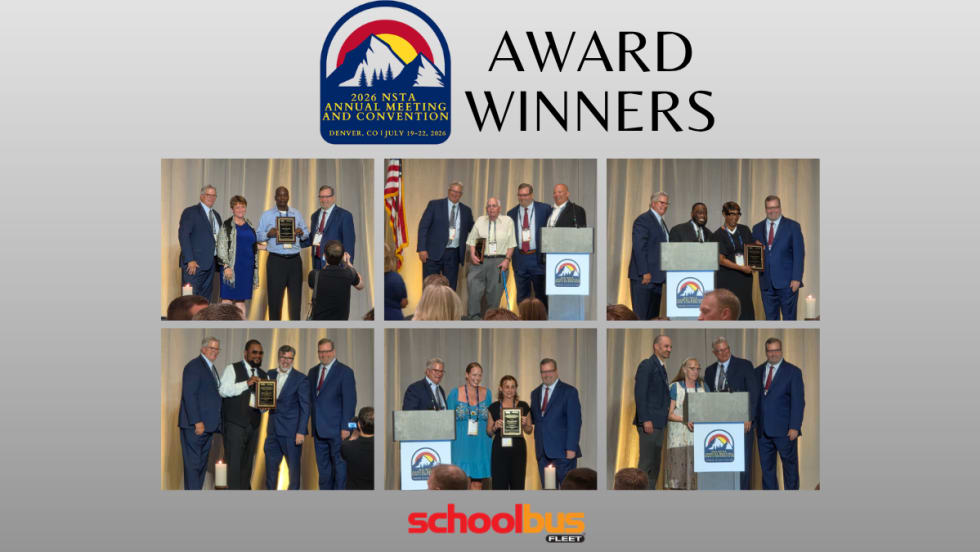
National School Transportation Association Presents 2026 Award Winners
Twenty-one individuals and contractor companies were recognized for excellence in student transportation at NSTA's annual meeting and convention in Denver.
Read More →
School Transportation Data Is Only as Powerful as the Story It Tells
Leaders say turning operational metrics into student-centered narratives can help districts justify investments and improve service.
Read More →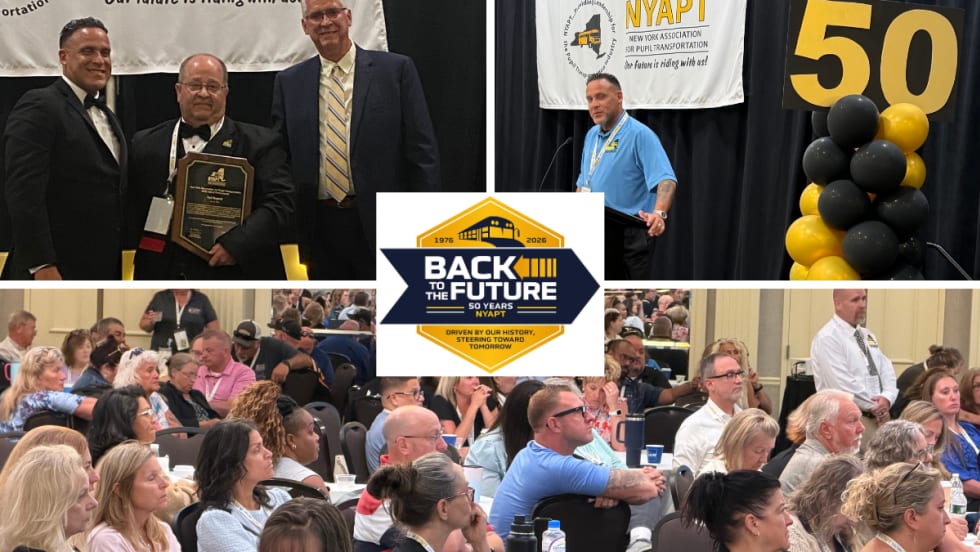
Photos: NYAPT Celebrates 50 Years at 2026 Conference & Trade Show
See highlights from NYAPT's 50th anniversary conference in Saratoga Springs, featuring educational sessions, awards, a trade show, networking, and more.
Read More →