


Last Year: Driver Shortage Remains No. 1 Challenge for Special-Needs Transportation [2025 Survey Report]
Special-Needs Transportation Shifts in 2026: More Riders, More Tech, New Pressures [Survey Report]
What’s changing in special-needs transportation? Operators report a rising need, easing driver shortages, growing tech adoption, and emerging challenges. Details here! Survey sponsor: AMF Bruns of America.
January 26, 2026
Keep reading for key findings from the 2026 School Bus Fleet survey on special-needs transportation trends and challenges from those who do it every day.
Photo: Sunrise Transportation/School Bus Fleet
3 min to read
School districts and contractors alike across the country are reporting increased demand for service for students with special needs, making an already complex landscape change even more quickly. As ridership increases, transportation providers are adjusting their fleets, staffing, and technology to keep pace.
Let’s dig into the progress being made and what looks different today than yesterday.
11 Takeaways & Shifts from the 2026 Survey
Special-needs ridership is rising again. A majority (57%) of respondents reported increased special-needs ridership year over year, reversing last year’s plateau and signaling renewed demand.
More buses are dedicated to special-needs service. The average share of fleet vehicles primarily transporting special-needs students jumped to 24%, up from 15% last year.
Door-to-door service continues to shrink. School-to-home special-needs bus stops dropped to 83%, down from 90%, amid tighter budgets, budget shortfalls, and evolving IEP interpretations.
Pay equity gains for special-needs drivers stalled but premiums grew. While most drivers still earn the same rate, those receiving higher pay for special-needs routes more than doubled, rising from 5% to 12%.
More aides are boarding special-needs buses. Nearly two-thirds of operators now include aides on all special-needs routes, continuing a three-year upward trend.
Mainstreaming continues to expand. A record 87% of respondents now report some level of mainstreaming, reflecting growing confidence that many students with disabilities can succeed on general-ed routes.
Supply chain disruptions persist, with less severity. More respondents felt some impact this year, but far fewer categorized it as severe or critical, indicating stabilization rather than resolution.
Uncertainty around outsourcing is growing. While most districts still don’t outsource, more are undecided, with interest split between traditional bus contractors and alternative transportation providers.
Small vehicles are gaining ground. Van, SUV, and car usage increased significantly, while Type C bus routes remained steady. In fact, vans now make up 14% of the total vehicle fleet for special-needs operators.
Technology adoption accelerated across the board, with more respondents using A/C on buses, videosurveillance nearing universal adoption, student tracking use more than doubling year over year, and child-check systems remaining widely in use.
The driver shortage is easing, but behavior challenges are rising. Fewer operators report major staffing impacts overtaking workforce shortages for the first time in years.
The following data was compiled and averaged from qualified online survey respondents, including transportation staff at school districts and contractors, collected in November and December 2025.
For reference, most survey respondents this year (56%) had small fleets with fewer than 50 total buses, though the average fleet size was 115.
Average Percentages Across Respondent Fleets
Vehicles primarily used for special-needs transportation: 24%
Riders with special needs: 22%
Special-needs riders using wheelchairs: 6%
School-to-home special-needs stops: 83%
Fleet vehicles that are vans: 14%
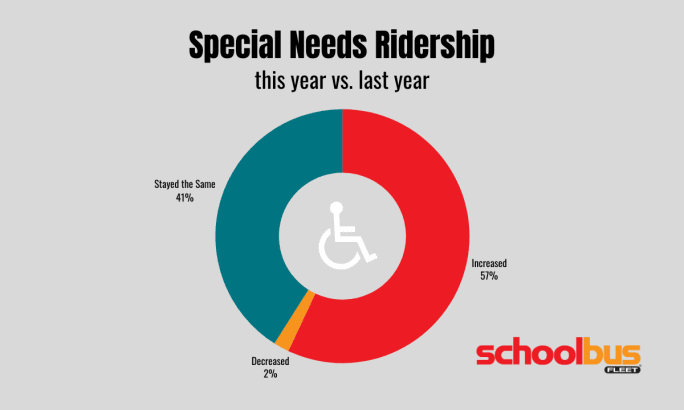
Last year’s results finding more stabilization has stalled. This year, fewer respondents reported the same number of riders with special needs, as more respondents noted an increase. (In 2025, 51% said it increased, and 46% called it the same.)
Source: School Bus Fleet
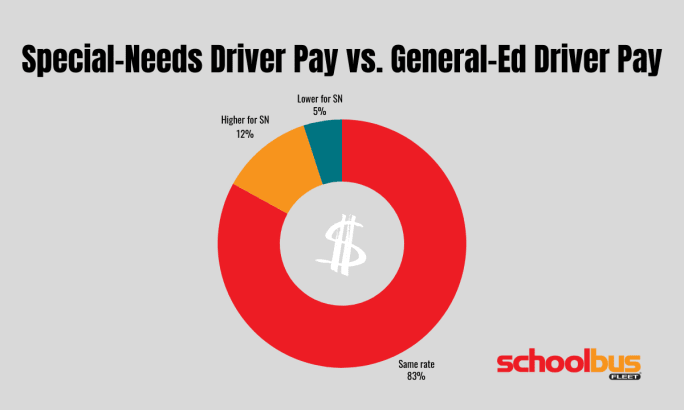
Last year’s jump in comparable pay between driver types halted. However, we saw a sizable increase in special-needs (SN) drivers receiving higher pay than their gen-ed counterparts this year (last year, just 5% of respondents paid them more). That’s a 140% increase!
Source: School Bus Fleet
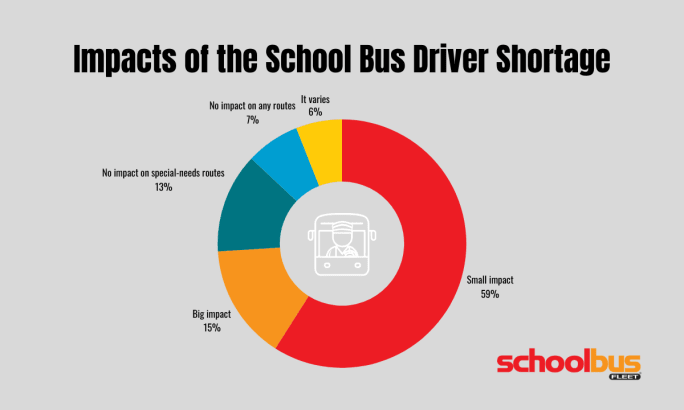
More districts and contractor operations are slowly overcoming the driver shortage. Those claiming a big impact fell from 23% last year, and those calling it a small impact rose from 49% last year.
Source: School Bus Fleet
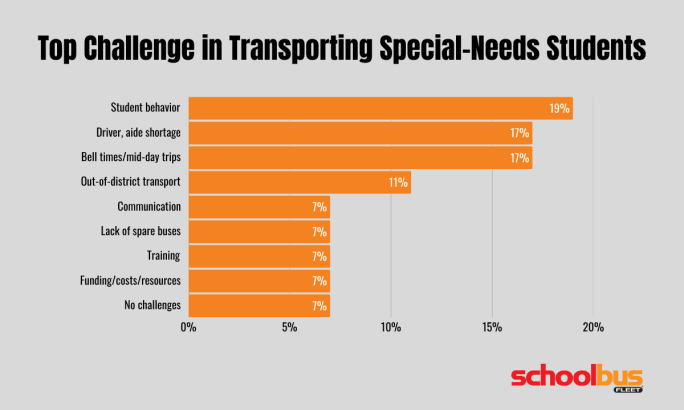
A slight upset this year, as student behavior rose to the top of operators’ biggest pain points on special-needs routes, more than doubling from last year, while the workforce shortage fell to second place on the list. Bell times and day trips also increased more than twofold.
Source: School Bus Fleet
Most Common Vans used for Special-Needs Transportation
Ford Transit
Dodge Caravan
Chrysler Pacifica
Toyota Sienna
Chevrolet Express
For the full survey report, please watch for the February 2026 issue of the magazine!
Subscribe to Our Newsletter
More Special Needs Transportation
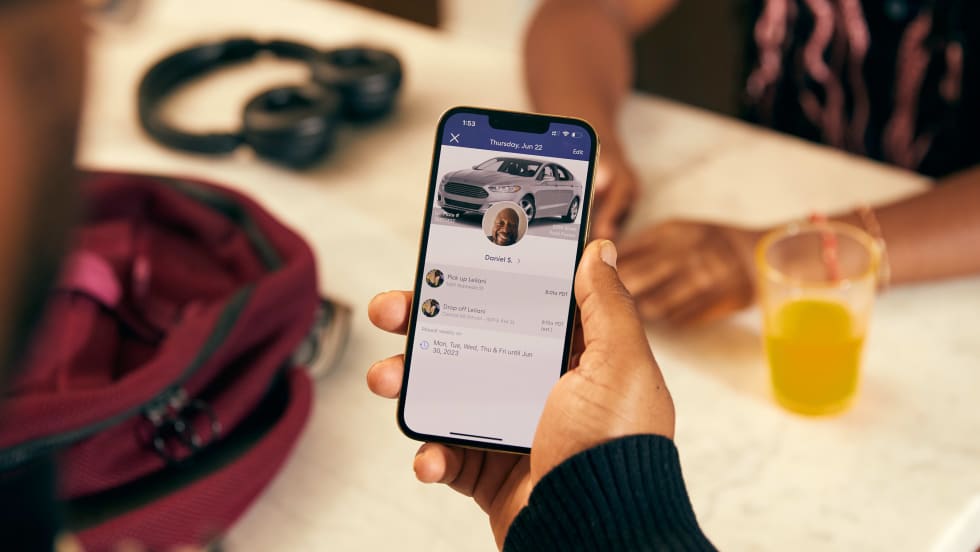
HopSkipDrive Launches New Safety, Driver Consistency Features for 2026-27 School Year
The company’s free ride recording, live ride tracking, and consistent driver assignments aim to improve safety and continuity for diverse student transportation needs.
Read More →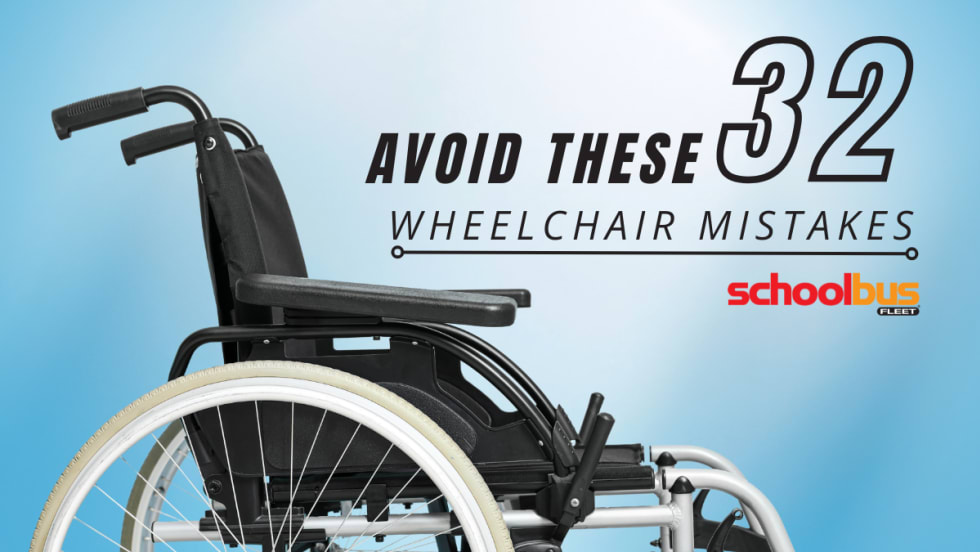
The Most Common Wheelchair Securement Mistakes on School Buses (and How to Fix Them)
Small missteps in wheelchair securement can have serious consequences. Here are 32 tips from experts to reduce risk and increase student safety on the bus.
Read More →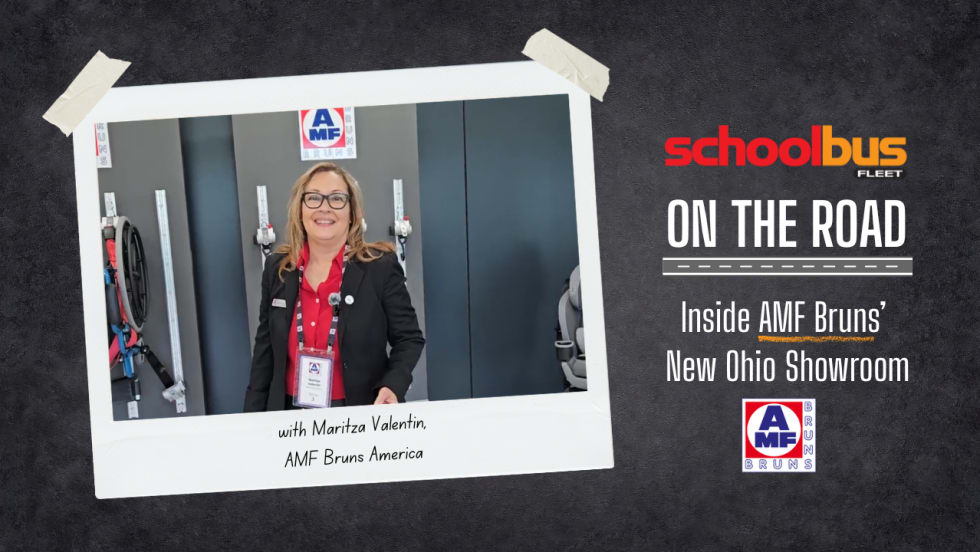
Inside AMF Bruns’ New Showroom: School Bus Securement Solutions Explained
Go inside AMF Bruns America’s new Ohio showroom with Maritza Valentin to see its FutureSafe technology, driver training tools, securement systems, and seating innovations.
Read More →
What AMF Bruns’ New Facility Means for Customers [Video]
Inside AMF Bruns’ new Stow, Ohio, operations: See how expanded space and innovation will enhance customer support and operations.
Read More →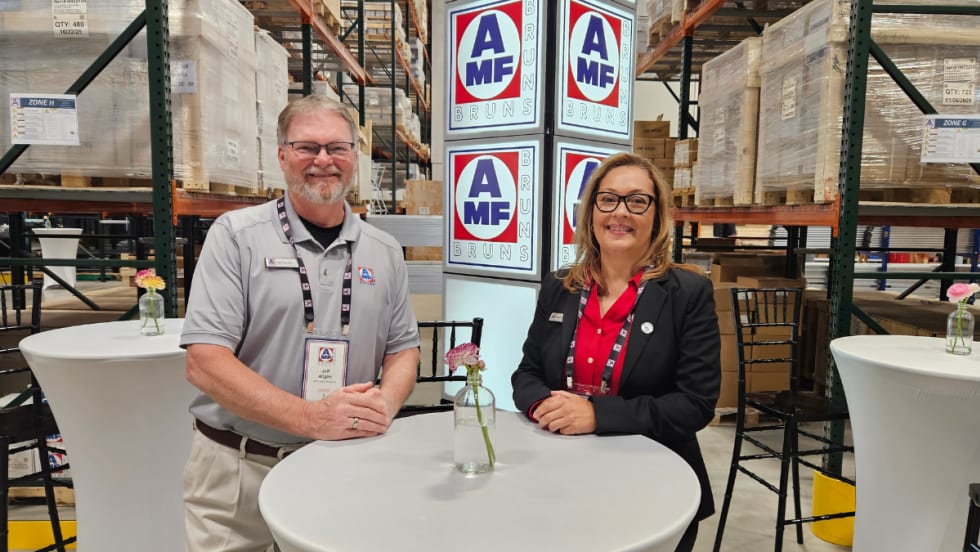
AMF Bruns Expands in Ohio, Investing in Growth and Community
With expanded production space, local investment, and a growing workforce, AMF Bruns is scaling its U.S. presence. Here’s an exclusive first look inside the new Stow, Ohio, HQ.
Read More →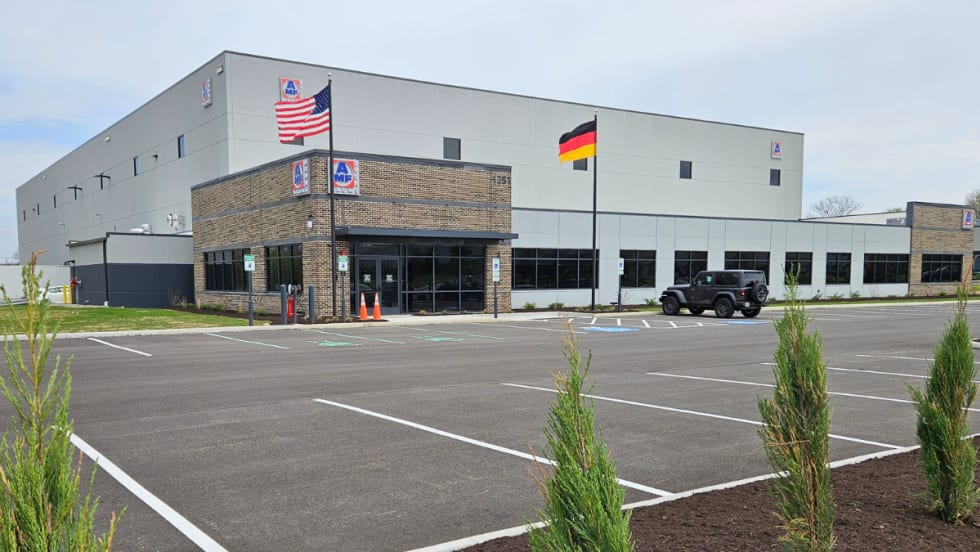
Inside AMF Bruns of America’s New Ohio Manufacturing Facility [Photos]
Take a behind-the-scenes look at AMF Bruns of America’s new 41,000-square-foot Stow, Ohio, headquarters, featuring advanced manufacturing, expanded space, and future-ready mobility solutions.
Read More →
First Student Boosts Student Support in Wichita & Texas
First Student and Wichita Public Schools are using behavioral support strategies to improve student ride experiences, while a separate initiative expands access to after-school programs through a bus donation.
Read More →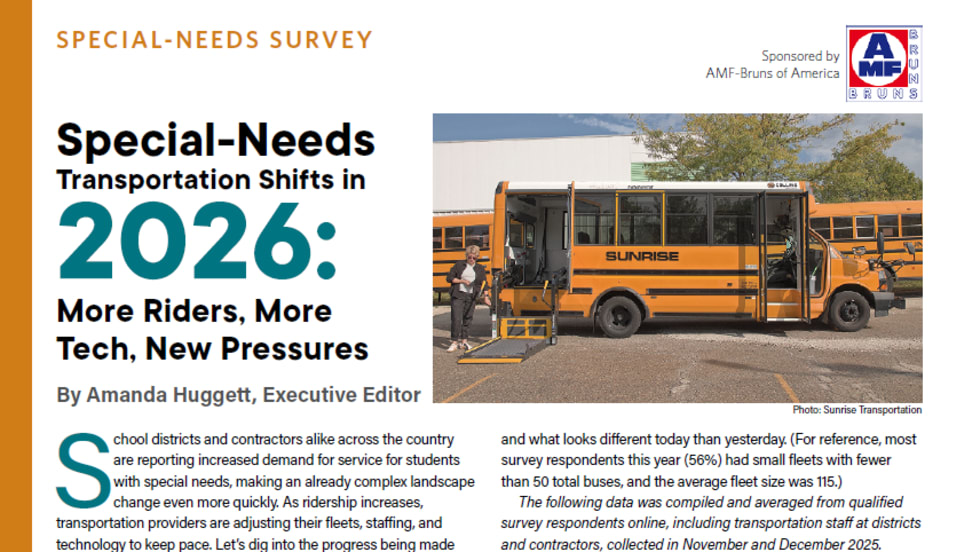
2026 Special-Needs Transportation Survey
What’s changing in special-needs transportation? This year, student transportation operators report a rising need, easing driver shortages, growing tech adoption, and evolving challenges. Sponsored by AMF Bruns of America.
Read More →
The Lived-Experience Gap in Mobility Tech: An Expert Take on Safe Student Transportation
Brianna Pauwee, a product application specialist at AMF Bruns of America and a wheelchair user, drops in to The Route to share practical securement and training insights, plus the story behind the new “Beyond Mobility” podcast. The Route is sponsored by IC Bus.
Read More →
Sponsored•February 11, 2026
What Transportation Gets Wrong About Wheelchair Securement (And How to Fix It)
Brianna Pauwee, product application specialist at AMF Bruns of America and a wheelchair user shares practical securement and training insights, plus why she launched the “Beyond Mobility” podcast. The Route is sponsored by IC Bus.
Read More →