

U.S. State-by-State School Transportation Statistics 2024-25
January 1, 2026
Sponsored by
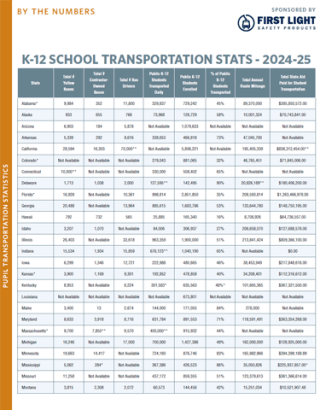
School Bus Fleet's School Transportation Statistics annual report provides a snapshot of K-12 school bus operations in the United States and the market health for new school bus sales in North America.
What will you find inside?
- Total yellow buses.
- Total school bus drivers.
- Students enrolled & percentage transported.
- Annual route mileage.
- Totals and averages for each by state.
- Sales of Type A, C, and D school buses in total.
- Sales of Type A, C, and D school buses in Canada vs. the U.S.