

U.S. State-by-State School Transportation Statistics 2023-24
January 3, 2025
Sponsored by
School Bus Fleet Magazine
School Bus Fleet's School Transportation Statistics annual report provides a snapshot of K-12 school bus operations in the United States and the market health for new school bus sales in North America.
What will you find inside?
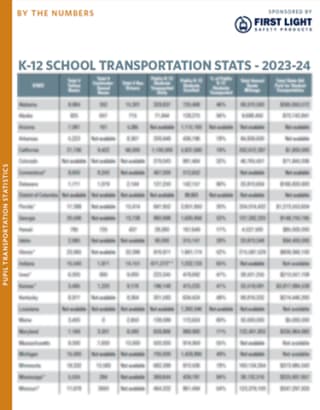
Total yellow buses.
Total school bus drivers.
Students enrolled & percentage transported.
Annual route mileage.
Totals and averages for each by state.
Sales of Type A, C, and D school buses in total.
Sales of Type A, C, and D school buses in Canada vs. the U.S.