

Stats show steady growth in contracted school buses
Data collected by SBF over the past six consecutive years show increases in the proportion of contractor buses being used, from one-quarter in 2007-08 to one-third in 2012-13.

In lean years for education funding — which is starting to seem like every year — school districts typically look for ways to run an even tighter ship.
When it comes to budget cuts, transportation is often a target. But innovative directors have often found ways to cut costs without sacrificing bus service.
For example, some districts have saved millions of dollars per year by restructuring their school bell times. With buses serving schools on a multi-tiered system, more students can be transported with fewer buses.
There are many other ways to increase transportation efficiency, and thereby reduce expenses. But for some districts, it may seem that they’ve already implemented all options for optimizing efficiency.
Many districts have had success in reducing transportation costs by contracting out some or all of their school bus service. On the other hand, many other districts will tell you that they can run a more cost-effective operation in-house.
I’m not here to tell you whether outsourcing school bus service is a good fit for your district. But I will suggest that this option appears to have been utilized by a growing number of districts. And I have data to back up that assertion.
In our January 2012 issue (pg. 60), we ran an editorial that showed growth in the outsourcing of school busing. So what has happened in the three years since then?
First, some background information: Each year, SBF collects U.S. school transportation data (see pg. 29 in our 2015 Fact Book), which breaks down most states’ school buses by how many are owned by districts, contractors or the state.
With this data, we can get an estimate of the proportion of school buses in the nation that are contractor owned, and we can compare it to previous years.
Here’s what we found in our previous editorial:
• 2007-08 school year: 25.6% contractor buses
• 2008-09: 26.9% contractor buses
• 2009-10: 28.1% contractor buses
Now, we’ve done the same calculations for the data we’ve compiled in the years since that editorial. Here’s what we found:
• 2010-11 school year: 28.3% contractor buses
• 2011-12: 30.0% contractor buses
• 2012-13: 34.7% contractor buses
Keep in mind that these are estimates, and they only take into account the school buses that states were able to categorize as district, contractor or state owned (some states can’t give us that breakdown). However, these percentages are useful in making year-to-year comparisons, and now they’ve shown increases in the proportion of contractor buses for six consecutive years.
Here’s some corroborating evidence: In our previous editorial on this topic, we cited the Mackinac Center for Public Policy’s 2011 Michigan School Privatization Survey, which found that 12.2% of districts in the state were using privatized bus service. That was nearly triple the 2006 rate of 4.4%.
Now, the Mackinac Center’s 2014 survey shows that 24% of Michigan districts contract out for transportation services.
Again, whether outsourcing is the best fit for any given district is a question that should be explored locally. But the numbers continue to suggest that more districts are embracing the contracting option.
More Safety

The Driver Shortage Playbook
Driver shortages are still a major challenge for student transportation fleets, but the real issue has shifted. It’s no longer just about filling seats quickly. It’s about finding safe, reliable drivers who meet performance expectations and want to stay. The Driver Shortage Playbook covers why traditional recruitment tactics are falling short and how school fleets are adapting with smarter hiring, stronger retention strategies and a greater focus on driver quality.
Read More →
Pro-Vision Launches AI-Powered 360° Camera System
The new Birdseye camera delivers real-time AI-based pedestrian and vehicle detections, full visibility around the bus, and telematics integrations.
Read More →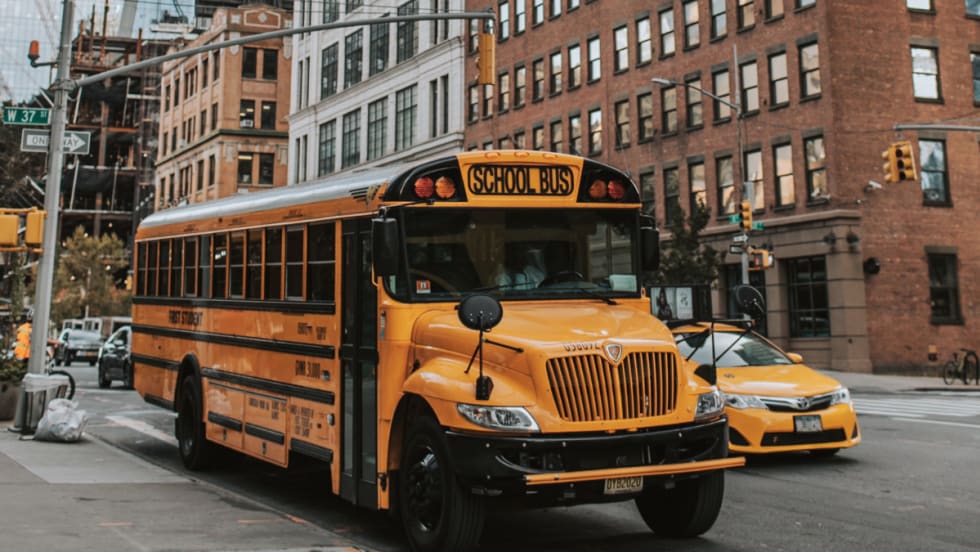
N.Y. & N.J. Coalitions Call for Modernized Transportation for Vulnerable Students
New statewide coalitions in New York and New Jersey are urging lawmakers to expand student transportation options for vulnerable students amid ongoing driver shortages.
Read More →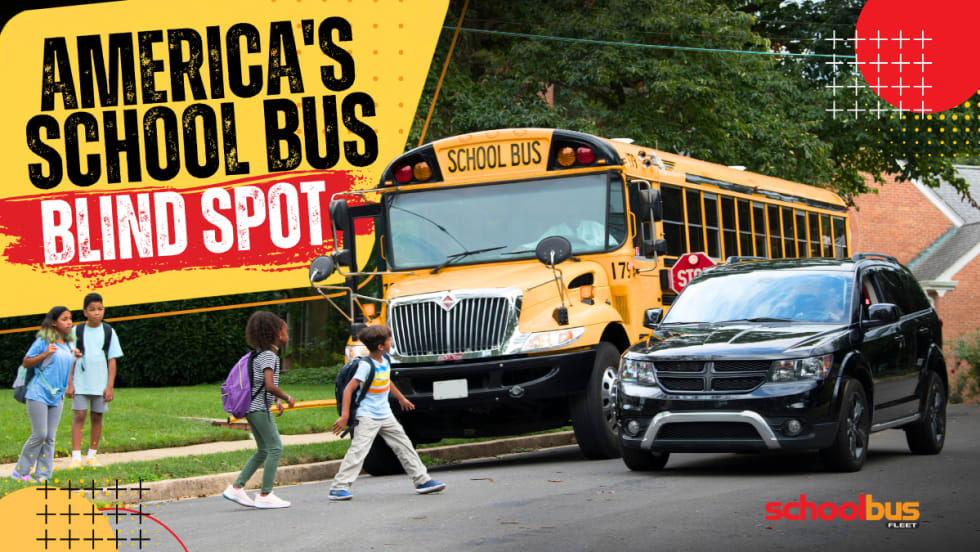
America Has a School Bus Passing Problem — and Distraction Is Making It Worse
Illegal school bus passing remains a major safety threat as distracted driving rises. This op-ed explores why awareness, enforcement, and stop-arm cameras matter more than ever.
Read More →
School Bus Laws to Watch: New York Delays EV Mandate
Plus, federal lawmakers seek new funding for school bus safety as states weigh stop-arm enforcement, disability protections, and education spending.
Read More →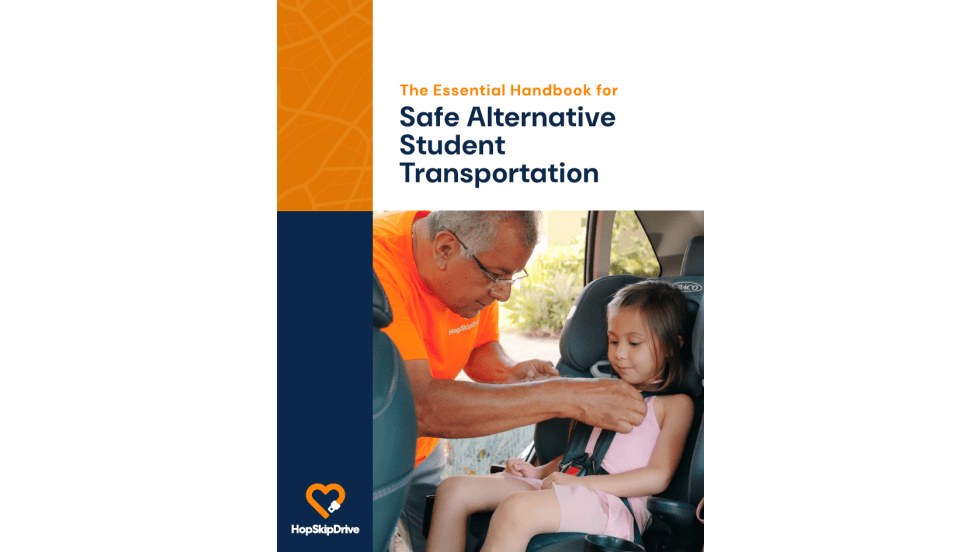
The Essential Handbook for Safe Alternative Student Transportation
Your district's "exception riders" — students with IEPs, those experiencing homelessness, foster care youth — deserve more than a middleman solution. This handbook breaks down exactly what to look for in a supplemental transportation partner: from driver vetting and regulatory compliance to proactive safety technology. Because getting a ride isn't the same as getting a safe one.
Read More →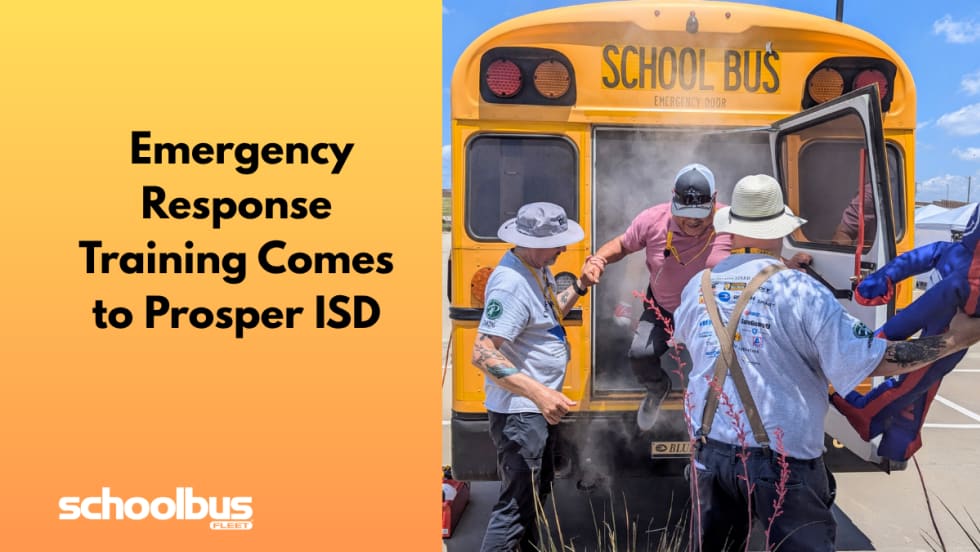
Operation STEER Brings Emergency Response Training to North Texas
Prosper ISD hosted the third annual training for transportation professionals across 67 districts to learn how to respond to emergencies, such as rollovers and evacuations, and proper use of safety equipment.
Read More →
Florida District Relaunches BusPatrol School Bus Camera Program With New Safeguards
After being suspended over due process concerns, Miami-Dade schools and law enforcement are restarting the AI-powered stop-arm camera program with new oversight.
Read More →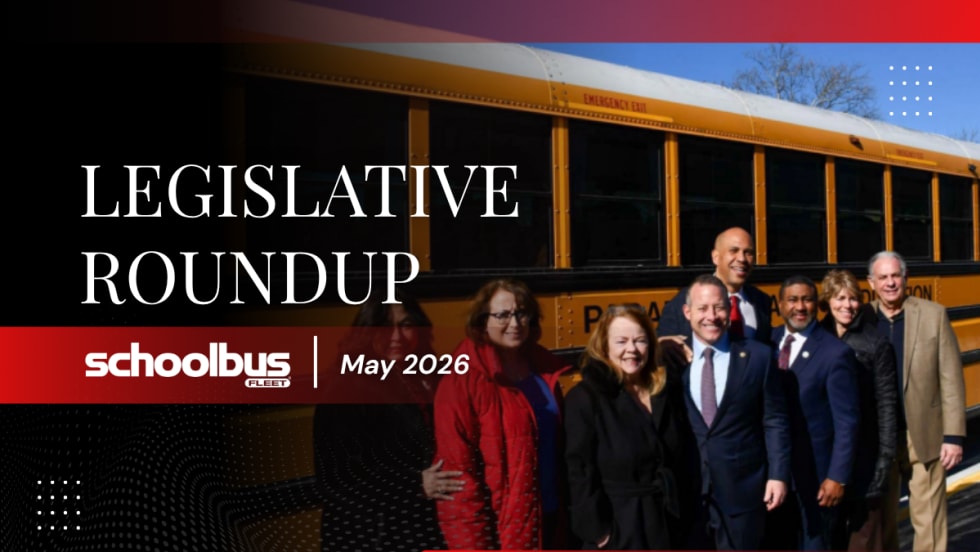
School Bus Laws To Watch: Seat Belt Bills, Funding Fights & EV Changes
From national bills on seat belts and driver oversight to driver awareness campaigns referencing “Finn’s Rule” and ongoing transportation funding debates in Alaska, here’s the latest in school bus legislation across the U.S.
Read More →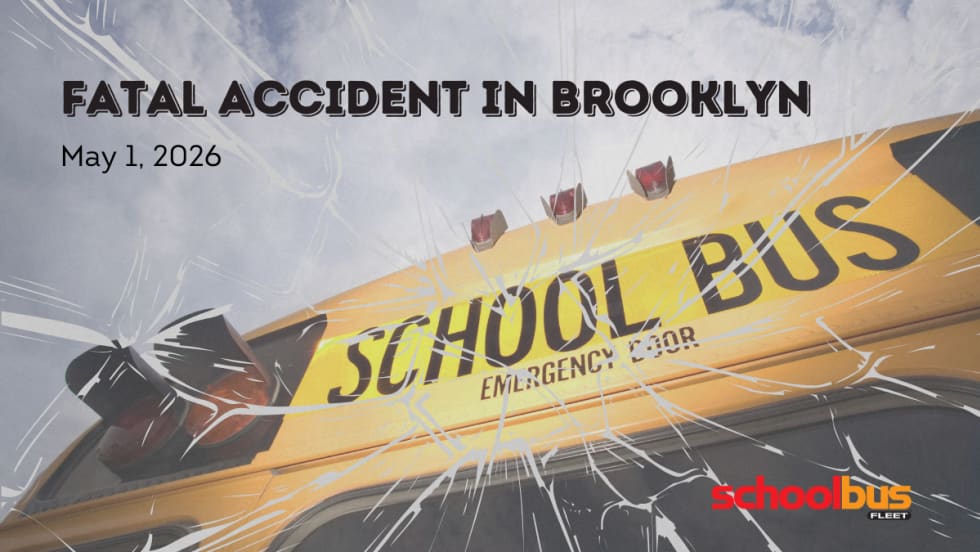
9-Year-Old Boy Killed by School Bus at Busy Brooklyn Intersection
A Williamsburg community is mourning after a child was fatally struck by a private yeshiva bus, prompting calls for urgent safety improvements at the high-traffic crossing.
Read More →