

New NAPT Technology to Help Optimize KPI Data
The business intelligence platform will display actionable data in a user friendly dashboard and allow transportation directors to share it and collaborate on solutions. It will be unveiled at the association’s annual Summit in November.

The National Association for Pupil Transportation has developed an online platform designed to help pupil transportation providers track, analyze, and compare KPI data with peers who are similar to them and collaborate on solutions.

Tracking key performance indicators (KPIs) is useful for assessing the needs of a school transportation operation, but can be difficult, especially when it involves gathering data from multiple sources. Then, once that data is collected, the challenge for school transportation directors is to determine how to use it to improve their operation.
The National Association for Pupil Transportation (NAPT) has developed a solution for transportation directors and managers to help them do this more efficiently in the form of an online platform that, in part, helps them look to each other for more insight and solutions. As part of the Data Driven Decisions (3D) Project, which started in 2012, volunteers developed metrics that form the core of a dashboard designed to help pupil transportation providers quickly analyze their data and connect and brainstorm with districts similar to theirs to solve problems or make improvements.
That new business intelligence platform is described by Mike Martin, NAPT’s executive director, as a combination of LinkedIn, Facebook, and Match.com, delivered in a platform like the wearable technology activity tracker Fitbit, with a customizable dashboard displaying various analytics based on KPIs.
Reflecting on his years as a transportation director, John Hazelette, a school transportation consultant and former transportation director at Norfolk (Va.) Public Schools, who also serves on the NAPT board, says there is a great need for a mechanism to efficiently capture and interpret key data that transportation directors can use in many ways, such as for budgeting, or quickly obtaining information for employers or stakeholders. Hazelette worked closely with NAPT’s Martin and the NAPT technology team on the core KPIs and data points.
Easier KPI data tracking
The platform will track the same KPIs as most districts, gather more insight with that data, and display it in a visually friendly way, says Steve Simmons, transportation director at Columbus (Ohio) City Schools, NAPT 3D Project liaison, and executive committee member.
“[Now,] you have to go here, go there, and call this department,” Simmons says. “That data will all be on this one platform.”
Users enter 27 KPI data points, such as number of buses, drivers, and students transported, into the platform, and then receive about 12 baseline metrics on their operation, such as cost per route, per bus, per day, average route speed, and total overhead costs, Martin says.
Although all pupil transportation professionals are interested in certain core topics, not all of them are interested in the same ones to the same degree, Martin says. However, all student transportation providers need the same core data. NAPT looked at the KPIs that school transportation managers wanted to measure and created the core component of the platform: “essential KPIs.”
Drilling down for actionable data
The second platform component contains the user’s operational data, such as number of miles and hours for each route, employee wages, maintenance costs per mile, and miles per gallon, and is designed to conduct more in-depth analysis. The operational data appears on the user’s dashboard, which can include about 22 total metrics. Users can also select another district’s data and view it alongside their own on the dashboard, compare that data, and then potentially contact the user at that district.
That component would help a district Hazelette had worked with as a consultant that was considering whether to modify its non-transportation zone.
“You can go through routing systems and say ‘X number more children need to be transported,’ and you can equate that to number of buses, but what is the cost? Not just the purchase of the bus and the cost of the driver, but what are the maintenance, fuel, staffing costs going to be? With this platform, we hope that information is going to be available at a keystroke.”
Buses produce a lot of data, and the challenge is interpreting it, Simmons says. With 800 buses and 1,000 employees, having a tool to input some basic data — route cost, mileage, fuel — and make several calculations could save him countless hours, he says.
“We are wasting time searching for data and [piecing it] together, and you’re not sure what to do with it. [With the platform], we’ll be able to use this data to our advantage to find ways to reduce routes, miles, and our carbon footprint.”
For example, he adds, when participating in the pilot, his district found out its 2010 model buses are getting better mileage than its 2014 models.
“[Before,] I could input data but would never be able to find out that the 2010s are getting better mileage. It gives us more data that we’ll be able to dig down into and take action on it."
“We are wasting time searching for data and [piecing it] together, and you’re not sure what to do with it. [With the platform], we’ll be able to use this data to our advantage.”Steve Simmons, transportation director at Columbus (Ohio) City Schools
Data sharing, collaboration
In addition to “essential KPIs,” there are four modules: safety, maintenance, fleet, and financial. Each offers another 60 to 80 data points that plug and play into the essential platform. The modules can be purchased and added to the essentials component.
In each module, a community of school districts can share the basic platform and metrics. For example, if 100 districts sign up as users for the maintenance module, they can choose to share their data on that topic.
“It’s like creating secondary communities,” says Jim Regan, a business intelligence specialist. “The big community is the essential [KPIs] platform community, and if other users want to input and collect additional data on the other modules, they can join that user community.”
The platform will give users an opportunity to see other users’ profiles, which will include KPIs such as the number of buses, drivers, mechanics, students transported, schools they serve, whether their labor force is unionized, employee wages, etc., find a match, and contact them, Regan adds.
Regan led the product’s development, part of which is a three-member product advisory group of NAPT board members and 19 U.S. school districts with varying geographies and demographics, collecting data and compiling profiles to test the platform.
There is also a component, similar to LinkedIn, that notifies users about other users who are interested in the same topics and asks if they want to send an invitation to connect and share data. They can also invite others that they think are interested in that topic and create what is called a work group, enabling several users to discuss a topic, such as improving miles per gallon, and share best practices or ideas for solutions, create a project plan and a schedule for the group to implement.
When including the four modules, users would have access to about 225 total data points to provide them a variety of ways to find other users similar to them, Martin says.
The goal in creating the platform is to give pupil transportation providers the opportunity to “connect without borders,” he explains.
One of the lessons learned by NAPT board members as they worked on the 3D Project was that people most often compare themselves with their neighbors as opposed to people who are truly similar to them, he adds.
“I could be in a city that has 4 million people and the city next door could have 12,000 people, and we really don’t have a lot in common other than the weather.”
However, two districts that happen to be 3,000 miles apart may share many similarities, but not know it.
“Those are the kinds of connections that people really need to make,” Martin says. “The local things happen naturally because we see each other on a regular basis, but that’s not always the best way to improve or analyze. It’s not really an apples-to-apples comparison.”
For example, Simmons says, users can view the data of a similar district and see that that district is getting 3% more miles per gallon and find out why by pinpointing operational differences.
The social media component can also enable a transportation director to provide to their district’s board of directors not only their own real-world numbers, but also real-world numbers from similar districts when making a case for program changes.
“These days, state and local decisionmakers expect instantaneous answers when they’re making decisions about resource allocation, and the process is becoming more competitive and complex all the time,” Martin says. “I truly believe our system will help the transportation department win more budget battles.”

Availability
The platform will be unveiled at the NAPT Summit in Kansas City, Missouri, in November.
NAPT plans to market the platform on an annual subscription basis, to school districts, state departments of education, or to private sector customers, such as school bus contractors. Additional data that contractors need to factor into their calculations, such as overhead and depreciation, could be integrated into the system.
Hazelette sees considerable potential for using the platform at the state level. “A state could have all districts use the same format for capturing data for state reports instead of having to go through this massive drill at the end of the school year, [gathering] all those key metrics throughout the schools. With a few keystrokes, your report is done.”
Hazelette adds that he hopes as the platform evolves, states will marry up some data points so that their annual reports will be similar and provide a better comparison of what the industry is doing from state to state.
“We’ll get truer, better data that will help our industry,” he says.
Additionally, by January 2017, NAPT plans to provide technical support and training on effectively using the platform, as well as consulting.
More Management
What Happens to a School Bus After Retirement? First Student Has a New Answer
Through a new partnership with Advanced Remarketing Services, proceeds from retired vehicle sales will support Special Olympics and other community-focused organizations while advancing sustainability goals.
Read More →
School Bus Logistics Adds 3 Data Analysts, Expands Routing Capabilities
Three new data analysts and a BusRight certification bring an added layer of support to the routing services districts already use.
Read More →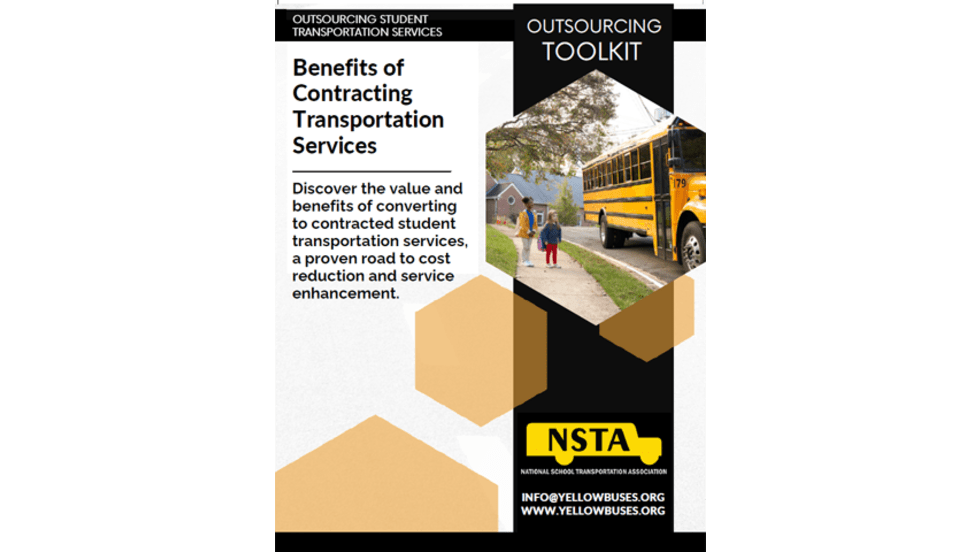
Outsourcing Student Transportation Services Toolkit
Did you know nearly 40% of school districts utilize a private contractor to serve their transportation needs? Explore why more school leaders are turning to contracted transportation services, and how outsourcing can create meaningful value without sacrificing control. Discover the practical benefits of a transportation services platform that provides flexibility with coordination.
Read More →


EverDriven Debuts TripCentral as New District Transportation Portal
The new transportation management hub takes over the district portal to power trip planning, operations, visibility, and intelligence for school district transportation needs.
Read More →
Lessons Learned from 4 Decades in Transportation: 5 Questions with Craig Beaver
Sit down with longtime transportation leader Craig Beaver moments before he retires, as he reflects on his career leading up to his role at Beaverton School District in Oregon and the secrets to leading great teams.
Read More →
BusRight Honors Texas Driver With Inaugural Behind The Wheel Award
Selected from more than 300 nominations, Lawson Crook earned BusRight’s inaugural award for his dedication to students and safety.
Read More →
Craig Beaver’s Final Stop: Lessons from 43 Years in Transportation
After more than four decades in transportation, retiring Beaverton School District director Craig Beaver reflects on leadership, alternative fuels, AI, staffing, and what’s coming next. The Route is sponsored by IC Bus.
Read More →
What 43 Years in Transportation Taught Craig Beaver About Leadership
After more than four decades in transportation, retiring Beaverton School District admin Craig Beaver reflects on leadership, alternative fuels, AI, staffing, and what’s coming next.
Read More →
ASTP's Tod Eskra Named an Entrepreneur of the Year
The award from Ernst & Young honors visionary leadership behind one of America's fastest-growing student transportation contracting companies.
Read More →
Drivers and Technicians: Help Benchmark Today's School Bus Manufacturers
If you've spent time behind the wheel or under the hood, we want to hear your perspective on the buses you know best.
Read More →