

Report: Condition of state highways has improved
The Reason Foundation’s 19th Annual Highway Report indicates that nationally, the percentage of urban interstates that are congested fell below 50 percent for the first time since 2000. Pavement conditions on urban interstates are the best they’ve been since 1993, and traffic fatalities have fallen to the lowest levels seen since the 1960s.

State highway conditions are the best they’ve been in 19 years, according to Reason Foundation’s 19th Annual Highway Report. The recession is partly responsible for the improvement in road conditions: People are driving less, which has helped slow pavement deterioration and reduced traffic congestion and fatalities.
The Reason Foundation study measures the condition and cost-effectiveness of state-owned roads in 11 categories, including deficient bridges, urban traffic congestion, fatality rates, pavement condition on urban and rural interstates and on major rural roads, and the number of unsafe narrow rural lanes. National performance in all of those key areas improved in 2008, the most recent year with complete data available.
California, Minnesota, Maryland, Michigan and Connecticut have the worst traffic. Over 65 percent of all urban interstates are congested in each of those five states. Nationally, however, the percentage of urban interstates that are congested fell below 50 percent for the first time since 2000, when congestion standards were revised.
Moreover, motorists in California and Hawaii have to look out for the most potholes on urban interstates. In those two states, 25 percent of urban interstate pavement is in poor condition. Alaska and Rhode Island have the bumpiest rural pavement, each with about 10 percent in poor condition. However, nationally, pavement conditions on urban interstates are the best they’ve been since 1993.
With the recession reducing driving, and engineering improving road design and car safety features, traffic fatalities have steadily fallen to the lowest levels since the 1960s. Massachusetts has the safest roads, with just 0.67 fatalities per 100 million miles driven. Montana and Louisiana have the highest fatality rates, at 2.12 and 2.02 fatalities per million miles driven, respectively.
Overall, North Dakota, Montana and Kansas have the most cost-effective state highway systems. Rhode Island, Alaska, California, Hawaii and New York have the least cost-effective roads.
Over the last two years, New Jersey has moved up from last to 45th in the rankings, but it still spends dramatically more than every other state. New Jersey spends $1.1 million per mile on state roads. The second biggest spender, Florida, spends $671,000 per mile and California spends $545,000 per mile. South Carolina had the lowest expenses, with just $34,000 per mile.
“We’re seeing several factors combine to produce significant improvement in highway conditions,” said David T. Hartgen, author of the report and emeritus professor of transportation studies at the University of North Carolina at Charlotte. “Over the last several years, states invested a lot more money to improve pavement and bridges. Spending increased 8 percent from 2007 to 2008, and per-mile spending on state roads has almost tripled since 1984, so you’d hope and expect to see improved performance. As pavement gets better, roads are widened and bridges get repaired, you’d also expect safety to improve. And the significant reduction in vehicle miles traveled during the recession has also played a role in slowing system decay. But as the states run short of money and deal with large budget deficits, we’ll see if this progress can be continued.”
To read the full report, click here.
More Safety

Pro-Vision Launches AI-Powered 360° Camera System
The new Birdseye camera delivers real-time AI-based pedestrian and vehicle detections, full visibility around the bus, and telematics integrations.
Read More →
NY Coalition Calls for Modernized Transportation for Vulnerable Students
A new statewide coalition is urging New York lawmakers to expand student transportation options for vulnerable students amid ongoing driver shortages.
Read More →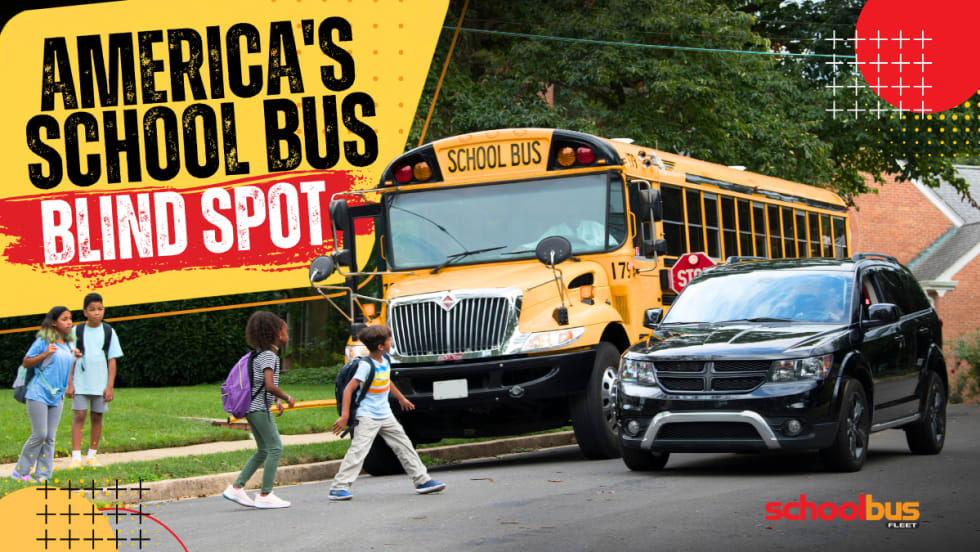
America Has a School Bus Passing Problem — and Distraction Is Making It Worse
Illegal school bus passing remains a major safety threat as distracted driving rises. This op-ed explores why awareness, enforcement, and stop-arm cameras matter more than ever.
Read More →
School Bus Laws to Watch: New York Delays EV Mandate
Plus, federal lawmakers seek new funding for school bus safety as states weigh stop-arm enforcement, disability protections, and education spending.
Read More →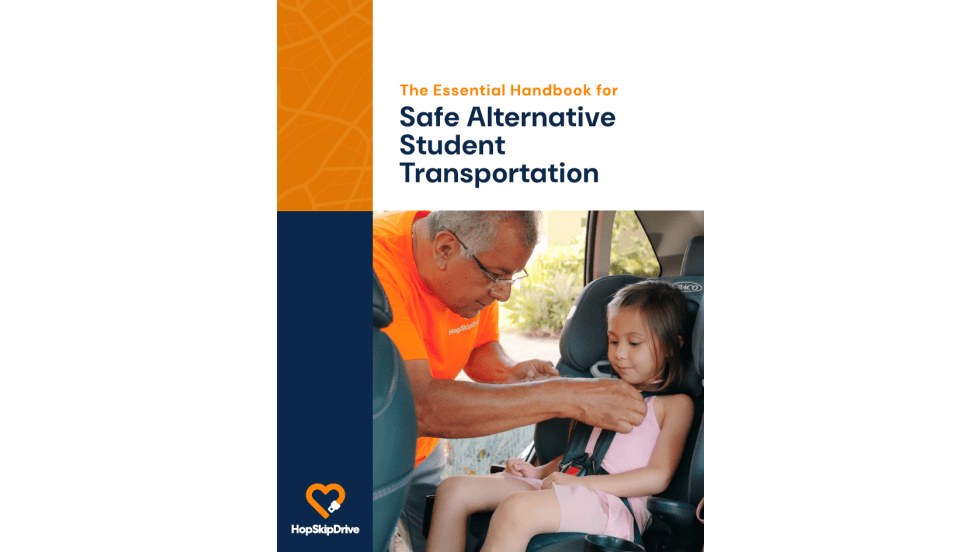
The Essential Handbook for Safe Alternative Student Transportation
Your district's "exception riders" — students with IEPs, those experiencing homelessness, foster care youth — deserve more than a middleman solution. This handbook breaks down exactly what to look for in a supplemental transportation partner: from driver vetting and regulatory compliance to proactive safety technology. Because getting a ride isn't the same as getting a safe one.
Read More →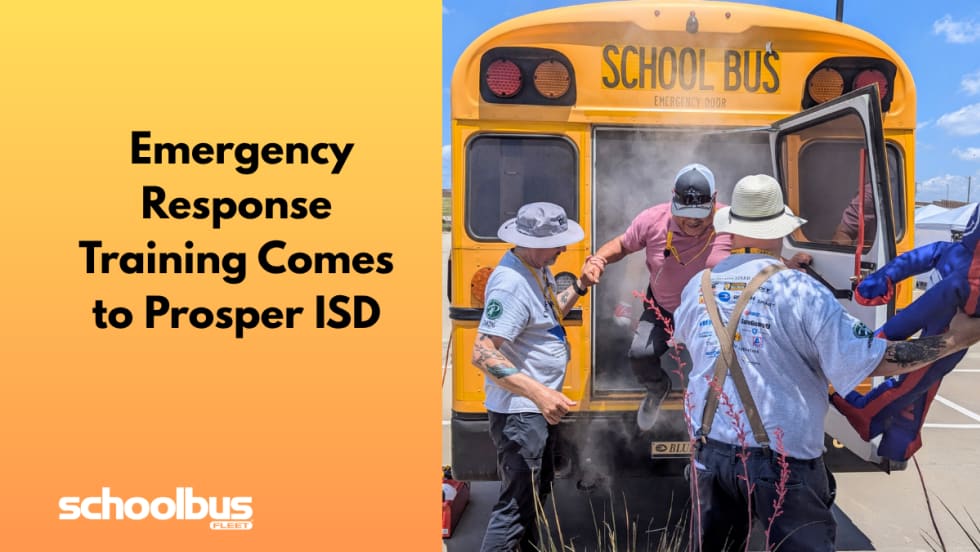
Operation STEER Brings Emergency Response Training to North Texas
Prosper ISD hosted the third annual training for transportation professionals across 67 districts to learn how to respond to emergencies, such as rollovers and evacuations, and proper use of safety equipment.
Read More →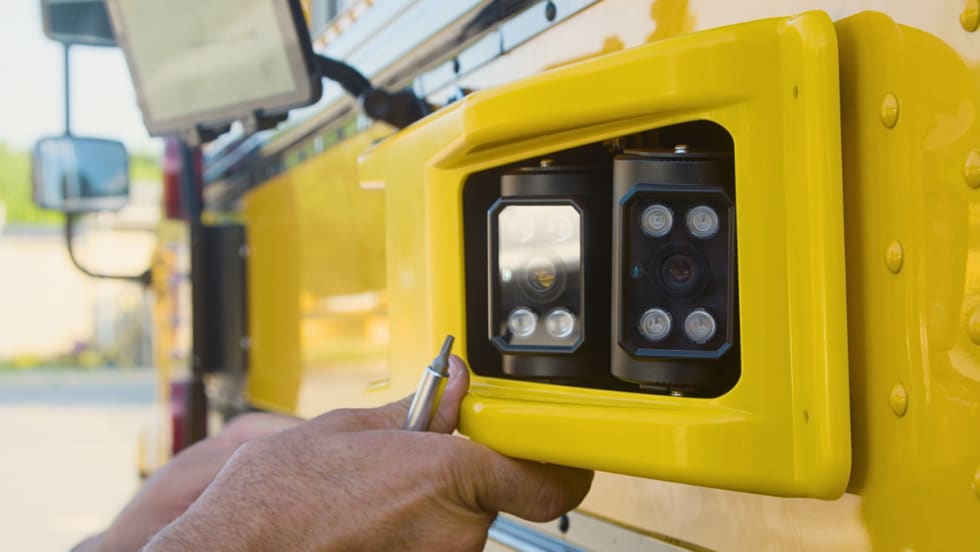
Florida District Relaunches BusPatrol School Bus Camera Program With New Safeguards
After being suspended over due process concerns, Miami-Dade schools and law enforcement are restarting the AI-powered stop-arm camera program with new oversight.
Read More →
School Bus Laws To Watch: Seat Belt Bills, Funding Fights & EV Changes
From national bills on seat belts and driver oversight to driver awareness campaigns referencing “Finn’s Rule” and ongoing transportation funding debates in Alaska, here’s the latest in school bus legislation across the U.S.
Read More →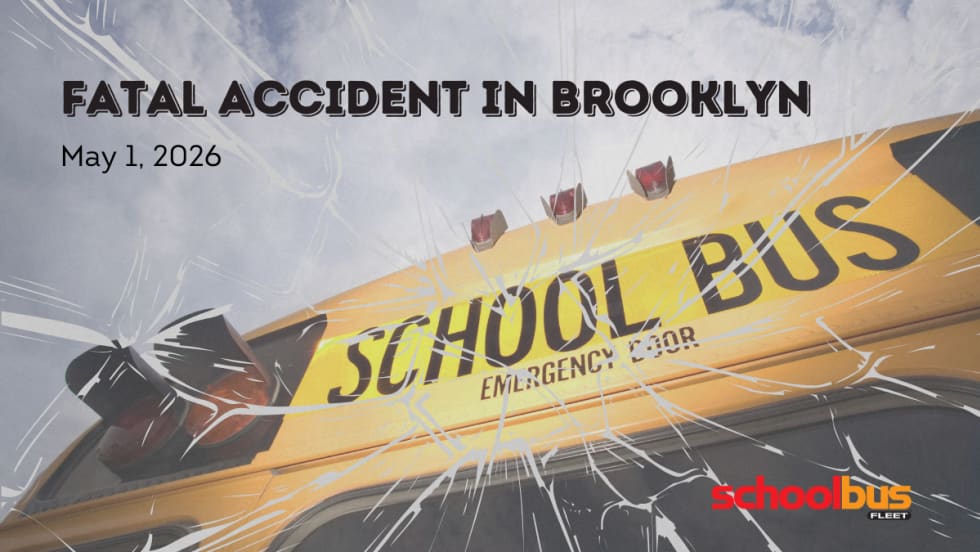
9-Year-Old Boy Killed by School Bus at Busy Brooklyn Intersection
A Williamsburg community is mourning after a child was fatally struck by a private yeshiva bus, prompting calls for urgent safety improvements at the high-traffic crossing.
Read More →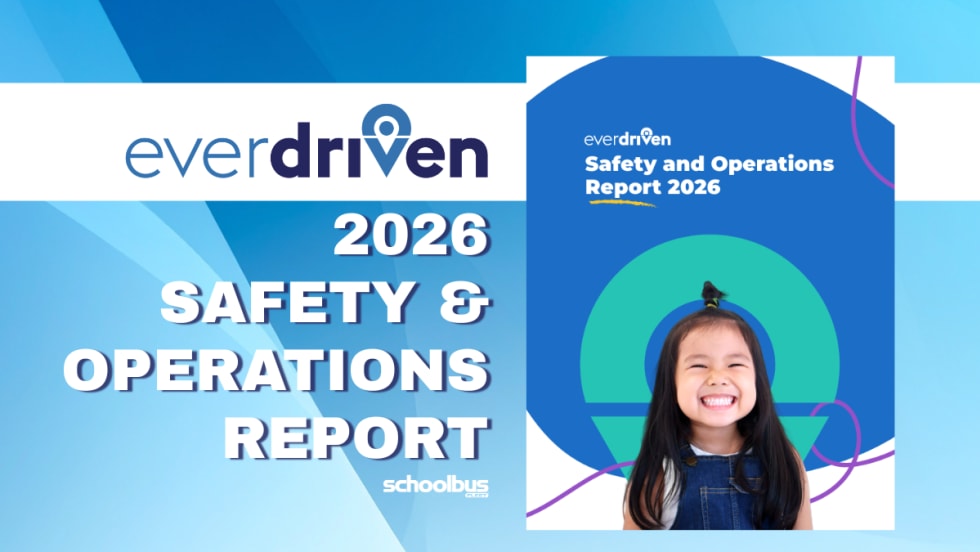
Does Reliable School Transportation Boost Attendance? EverDriven’s Data Says Yes
The new data shows 99.99% incident-free trips and strong on-time performance, reinforcing how dependable transportation, especially for vulnerable student populations, can help districts combat chronic absenteeism.
Read More →