

Taking Routing Data Beyond Routing
From key performance indicators to school redistricting to stop-arm violation tracking, there are many ways to benefit from the information in a computerized routing program.

Make no mistake about it — providing school transportation is a business that demands not only service, but also efficiency. And the lion's share of the expense — driver salaries and fuel — is directly related to routing.
It is hard to imagine, at least in medium-to-large operations, that planning and analysis can take place without computerizing bus routes in some form or fashion. How can we demonstrate efficiency if we can't quantify it?
Street names, intersections, geographical locations, student names, addresses, school and grade along with bus stop locations and driving instructions: Once we accept that some electronic form of these transportation data is essential, then it's time to think out of the box and realize the multitude of uses for those data.
In a related article in the August 2011 issue, we discussed the importance of documenting route hazards, including information in the computer routing database that helps drivers be aware of potential dangers each time the bus is routed across a given road segment. Such documentation could have prevented the multiple-fatality Fox River Grove bus-train crash in 1995. It is essential that drivers be provided with the critical safety information needed to protect their student passengers.
Here, we will look at some other uses of the basic data needed to plan and manage school buses, ranging from data analysis to relatively new applications.
Key performance, service indicators
The Council of the Great City Schools published a self-initiated report titled "Managing for Results in America's Great City Schools 2009" (available at www.cgcs.org/publications/Managing_for_Results_1009.pdf). In this report, the council identified key performance indicators (KPIs) relevant to school transportation, recognizing that there is value in measuring performance over time and comparing performance with other school districts. Implicit in this recognition is the need for the school district to have the ability to generate the KPIs.
When Charlotte-Mecklenburg (N.C.) Schools, for instance, embarked on a project of consolidating bus stops to improve efficiency for 2009-10, a natural question was, "How much farther were students being asked to walk?" The answer, extracted from their computer routing system, was that the average home-to-stop distance increased by only .06 miles, while reducing buses operated by 87 and cutting stops by 10,000 — all without losing riders as a result of the change.
Because the district has tracked these data for years, doing a comparison following the implementation of a new policy was very straightforward. In fact, being able to project the impact of new policy decisions was a key factor in securing school board approval.
The North Carolina Department of Public Instruction has been publishing transportation service indicators for five years now. The publication — available at www.ncbussafety.org — allows school districts to gauge their own service from one year to the next and to compare with other districts in a given year. Average and longest school bus riding times, bus utilization and student distance from home to stop are among the data that are tracked.
The picture painted by these comparative data helps school superintendents, board members and transportation directors — not to mention the general public — truly understand the result of transportation plans and the policy decisions that drive those plans.
School redistricting
Lee Lindsay, transportation director for Lee County (Ala.) Schools, gave a related presentation to delegates at the 2011 Southeastern States Pupil Transportation Conference in Oklahoma City in June.

Lindsay explained that he got into computer routing because of doubts that the current system of transportation was as efficient as it could be. But other benefits quickly began to surface. The use of these key data as they related to school redistricting was invaluable as the school district underwent a major change in school/grade combinations.
Much the same, I was involved in convincing school superintendents to volunteer for North Carolina's computer routing program — before it became mandatory in 1992. While transportation directors easily recognized the importance of maintaining bus stops and routes electronically, the superintendents and local boards (who ultimately made the decision) were most attracted by the ability to graphically analyze the composition of students in various geographical regions of the district.
Locating sex offenders
A list of locations of convicted sex offenders is just as easy to geocode (address-match) as the list of students to be transported. Since this is of such concern to parents, it only makes sense to use those identified locations when establishing bus stops.
Several of today's routing systems include options to alert the routing specialist when a stop is created within a specified distance of a sex offender location, and they can even store specifics of the age and gender of the victims (e.g., "convicted of molesting females, ages 6 and 16").
Describing another side benefit of computer routing, Lindsay vividly recalls a conversation with a grandmother related to the bus stop to which her granddaughter would be assigned. "Thank you, thank you, thank you!" she said to him, after being made aware of the nearby location of a known sex offender.
Regardless of whether the bus stop can be moved or must be located nearby, the mere knowledge that the potential danger exists is important to parents and caregivers.
In light of a significantly mobile population in Lee County — exacerbated by the presence of a military base — there are many parents who are unaware that known sex offenders might be living nearby.
"Sharing this information is something that doesn't cost us extra money but is very, very much appreciated by parents," Lindsay says.
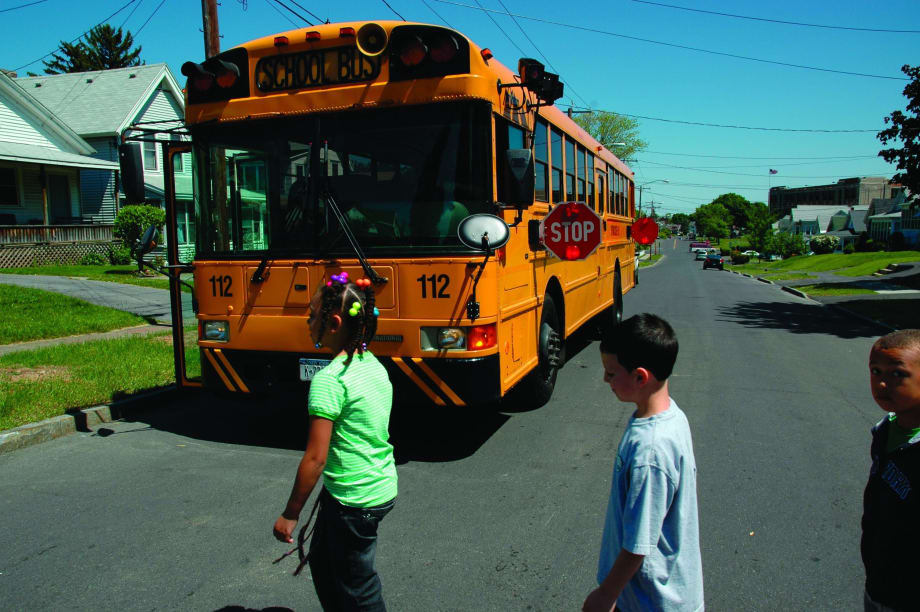
Stop-arm violations
The first national illegal stop-arm passing count, conducted by the National Association of State Directors of Pupil Transportation Services (NASDPTS), noted nearly 77,000 motorists illegally passing about 112,000 school buses participating in the project. This is a national problem that can be addressed locally.
By definition, stop-arm violations take place at bus stops. Routing systems maintain location information on bus stops, so the process of generating maps showing incidents reported by drivers is quite simple. These maps can then be passed along to local law enforcement agencies for their use in stepped-up enforcement, school bus ride-alongs, etc.
Knowing where the problems occur is step one. Sharing that information is a big step two.
Sharing information
In fact, there is so much information in a computer routing system that it seems a real shame to use it for a single purpose. There is a good deal of effort required to get a routing system up and running, calibrated and reliable. So why stop there?
The performance indicators, redistricting, sex offenders and illegal-passing examples described here are just a few applications where these basic — yet extensive — data can be used and shared for the overall benefit of transportation departments and the students they serve.
More Safety
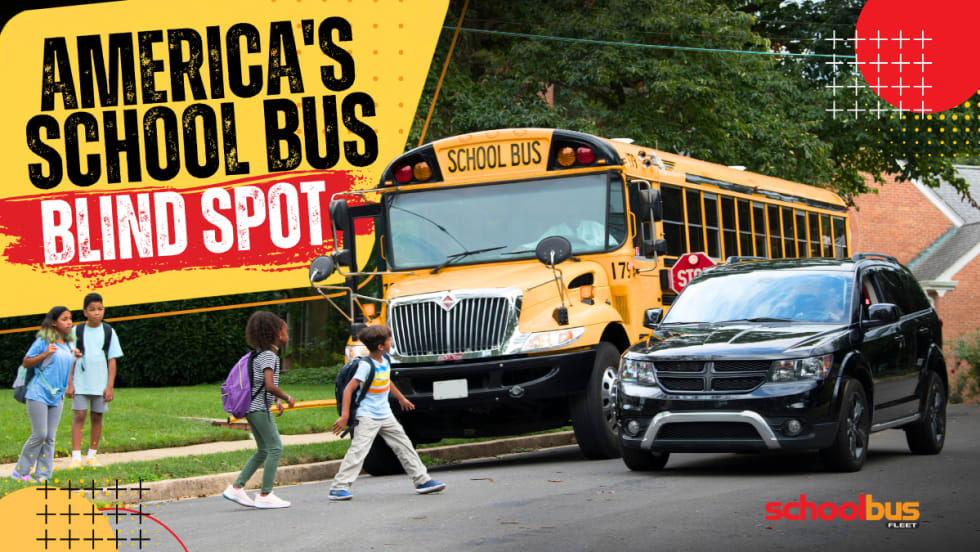
America Has a School Bus Passing Problem — and Distraction Is Making It Worse
Illegal school bus passing remains a major safety threat as distracted driving rises. This op-ed explores why awareness, enforcement, and stop-arm cameras matter more than ever.
Read More →
School Bus Laws to Watch: New York Delays EV Mandate
Plus, federal lawmakers seek new funding for school bus safety as states weigh stop-arm enforcement, disability protections, and education spending.
Read More →
The Essential Handbook for Safe Alternative Student Transportation
Your district's "exception riders" — students with IEPs, those experiencing homelessness, foster care youth — deserve more than a middleman solution. This handbook breaks down exactly what to look for in a supplemental transportation partner: from driver vetting and regulatory compliance to proactive safety technology. Because getting a ride isn't the same as getting a safe one.
Read More →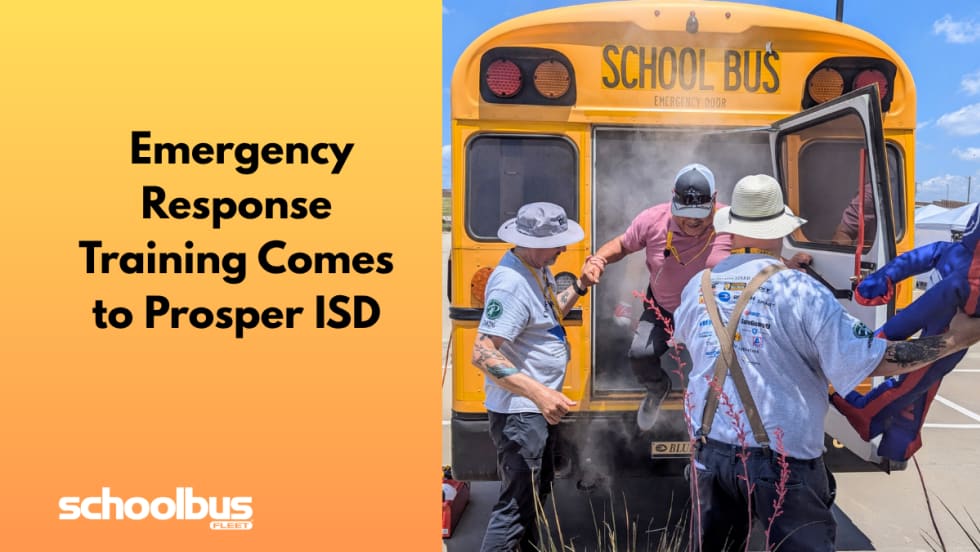
Operation STEER Brings Emergency Response Training to North Texas
Prosper ISD hosted the third annual training for transportation professionals across 67 districts to learn how to respond to emergencies, such as rollovers and evacuations, and proper use of safety equipment.
Read More →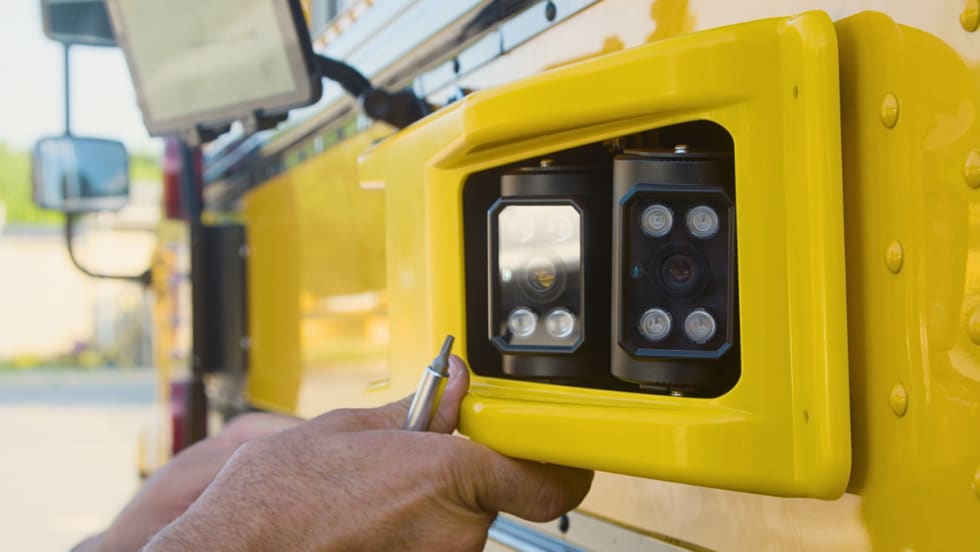
Florida District Relaunches BusPatrol School Bus Camera Program With New Safeguards
After being suspended over due process concerns, Miami-Dade schools and law enforcement are restarting the AI-powered stop-arm camera program with new oversight.
Read More →
School Bus Laws To Watch: Seat Belt Bills, Funding Fights & EV Changes
From national bills on seat belts and driver oversight to driver awareness campaigns referencing “Finn’s Rule” and ongoing transportation funding debates in Alaska, here’s the latest in school bus legislation across the U.S.
Read More →
9-Year-Old Boy Killed by School Bus at Busy Brooklyn Intersection
A Williamsburg community is mourning after a child was fatally struck by a private yeshiva bus, prompting calls for urgent safety improvements at the high-traffic crossing.
Read More →
Does Reliable School Transportation Boost Attendance? EverDriven’s Data Says Yes
The new data shows 99.99% incident-free trips and strong on-time performance, reinforcing how dependable transportation, especially for vulnerable student populations, can help districts combat chronic absenteeism.
Read More →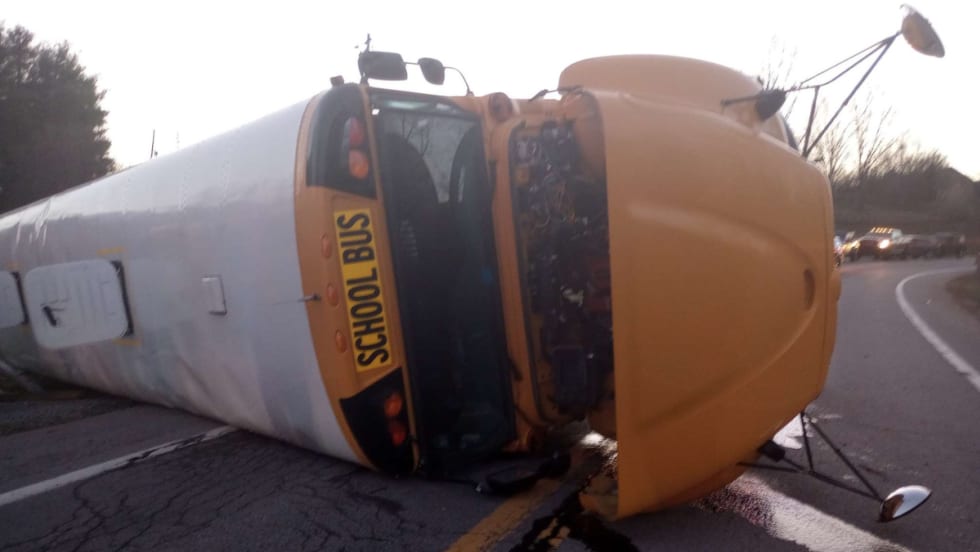
NTSB Calls for Alcohol Impairment Systems, Seat Belts After W.V. Crash Investigation
The federal agency's report asks NHTSA to require all new school buses to be equipped with vehicle-integrated alcohol detection systems and passenger lap-shoulder belts.
Read More →
2026 State of Student Transportation Report
Student transportation teams are being asked to do more with less, facing driver shortages, rising costs, and increasing safety expectations. This report uncovers how fleets are adapting, where technology is making the biggest impact, and why student ridership tracking is emerging as a top priority. Download the report to explore the key trends shaping 2026 and what they mean for your operation.
Read More →