

Key performance indicators — where to start?
Often, just by tracking and displaying results, employees become more aware of their own influence on the measurements.

In theory, almost everyone working in pupil transportation would agree that analyzing and understanding data is critical to managing operations. However, not every district has the same resources to develop and compare key performance indicators (KPIs).
During the National Association for Pupil Transportation (NAPT) Summit in October, the association’s KPI project was covered comprehensively, from a keynote speaker to several general sessions. A strong case was made for establishing industry-specific KPIs, which will allow school transportation directors to compare their operation to those of other school districts.
In one session, several school districts provided examples of transportation KPIs, many of which are tracked and reported to compare internal operations over time.
Keith Paulson of Anoka-Hennepin School District in Anoka, Minn., explained to the audience that his transportation department established KPIs as part of a district-wide initiative to measure and compare internal operations from one year to the next. Directors report KPIs on standardized vision cards or dashboards.
Smaller districts may not require their departments to report data on a vision card, but many track components to improve internal operations.
If you are a director in a small district with no history of using KPIs, where do you start? Telling your operational story requires a plot; you must decide what your plot will include.
Since gathering and analyzing data can be a daunting task, begin with something simple and easy to track. As Bill Bair of Colorado Springs (Colo.) School District 11 said, “It’s really just a matter of starting.”
Use your district’s existing vision, mission and goals to help determine your priorities. Most districts have a transportation vision statement sharing common terms. These include safety, reliability and efficiency. So start gathering internal data to establish a safety measure, a reliability measure and an efficiency measure.
1. Safety — number of accidents. Begin to record the number of accidents daily. Define accidents simply or in accordance with your state reporting definition. For instance, in Colorado, all accidents with more than $1,000 of damage must be reported to the Colorado Department of Education.
2. Reliability — number of road calls. Begin tracking the total number of road calls each day. First, define a road call — this could be as simple as tracking an interruption in service. Tally these daily; total them monthly and then annually. You now have a benchmark to compare with in the coming year.
3. Efficiency. Begin tracking the number of students riding the bus monthly. GPS programs make student tracking much easier, but even if you lack GPS, bus drivers can track actual ridership on a monthly basis. Pick the same day each month — for example, the first Tuesday of each month. Have each driver count the number of kids on the morning trip and the number on the afternoon trip. Divide the morning and afternoon total by two to establish an average.
Simple procedures can be used to track the data measures. Begin by using an Excel spreadsheet to input all monthly totals.
Once you begin tracking data, share the results with your staff. Often, just by tracking and displaying results, employees become more aware of their own influence on the measurements.
Just like with any new task, starting can be half the battle. Make this small step toward measuring three components, and you will have a wealth of knowledge to build upon in future years.
More Management
13 Industry Leaders Describe School Transportation in One Word
What word best describes the school bus industry today? We posed that question to over a dozen manufacturers, resulting in a revealing mix of perspectives on the challenges and opportunities ahead.
Read More →
Tyler Technologies Adds New AI, Transactions Leadership Roles
Two company executives are promoted to newly created C-suite positions to accelerate the company's long-term growth in both artificial intelligence and payments.
Read More →
Pro-Vision Acquires Convoy Technologies
The deal aims to broaden customer relationships and adds specialized vehicle video capabilities for commercial fleets.
Read More →


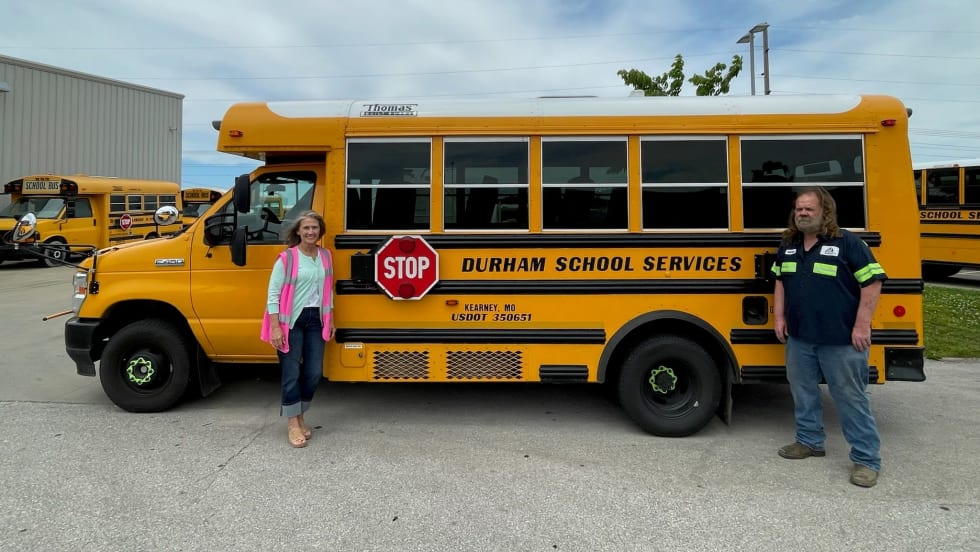
Durham School Services Maintenance Teams Earn Missouri Fleet Excellence Awards
Eight of the contractor’s school bus fleets achieved a distinction few maintenance teams earn during the state’s rigorous annual inspection program.
Read More →
How Incentives, AI, and Energy Markets Are Reshaping School Transportation
Sit down with Joe Annotti of TRC Companies to talk district grant funding, utility challenges, AI, and why school buses are evolving from transportation assets into energy assets.
Read More →
Inside the Contracting Shift: What School Transportation Operators Are Seeing Now
School transportation contractors weigh in on recent trends, costs, driver shortages, and the rise of multimodal student transportation.
Read More →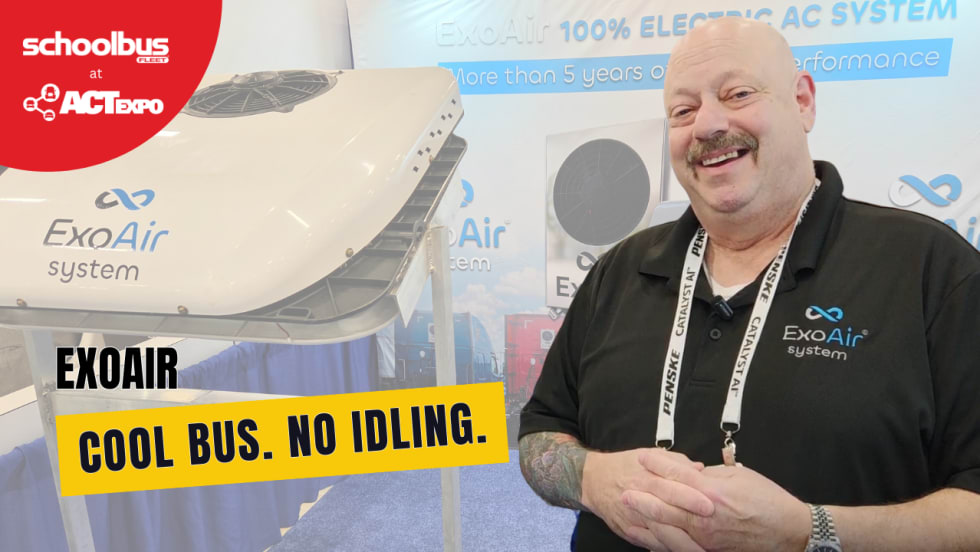
The No-Idling School Bus AC System
Take a peek at ExoAir Systems’ battery-powered cooling solution designed to run for up to 10 hours without the engine on, reducing fuel use and improving comfort for drivers and students.
Read More →
Geotab on Three Major Trends in School Transportation
School bus fleets are becoming more proactive than ever. From AI driver alerts to vehicle-to-grid opportunities, Geotab outlines the biggest technology trends transforming school bus operations.
Read More →
Gatekeeper Lands Major School Bus Deals as Revenue Surges
The video solutions provider announces contracts with Atlanta Public Schools and other fleet operators as it records quarterly revenue growth and expanding subscription business.
Read More →
Building Leaders Who Last: Creating a Successful Mentorship Program in Student Transportation
Discover five strategies for building an effective mentorship program to strengthen leadership development and support staff retention.
Read More →