


Tips & Advice: How and When to Buy a Used School Bus
A Closer Look at School Bus Lifecycle Costs
Pupil transportation operations are facing the same challenges -- escalating fuel costs, greater demands from parents and schools and crunched budgets.
June 1, 2006
3 min to read
Pupil transportation operations are facing the same challenges — escalating fuel costs, greater demands from parents and schools and crunched budgets. Everyone is doing what’s necessary to save a buck here and there, but at what cost?
Are we saving as much as possible through old-fashioned penny pinching? Can more be done to reduce costs without compromising quality? Responding proactively as opposed to reactively to high costs can make all the difference in the world.
Ron Lamparter, CEO and founder of Transpec Worldwide, offers two techniques to help operations reduce costs and improve quality, performance and reliability of the entire school bus fleet.
What is a Lifecycle Cost Analysis?
Lifecycle cost analysis, or cradle-to-grave analysis, involves calculating the cost of a system, unit or product over its entire life span.
Accordingly, lifecycle analysis of a system may include costs for planning, research and development, production, operation and maintenance.
Lifecycle cost analysis can also involve analysis of failure rates, cost of spares, repair times, component costs and warranty coverage.
Transportation managers may find this technique useful when requesting capital expenditures. It can provide the numbers and analysis to support why buying the lowest-priced system may not be the cheapest.
The following examples provide an illustration of how lifecycle cost analysis can give you the total cost of owning and operating equipment over the time period you expect to own it.
A Sample Cost Analysis
You need a new bus. You expect to keep the bus for approximately 10 years and estimate that it will travel 15,000 miles per year. You solicit bids, and based on manufacturer specifications, industry averages and your own experiences, you estimate fuel, maintenance and all other costs for each bus:
Bus A will cost $35,000, $3,000 per year to maintain and will get 10 mpg.
Bus B will cost $37,000, $2,000 per year to maintain and will get 15 mpg.
Bus C will cost $40,000, $1,000 per year to maintain and will get 20 mpg.
Department policy requires you to purchase the least expensive bus. Which do you purchase?
Bus A is the cheapest to purchase. However, it turns out to be the most expensive to own and operate. Bus C is the least expensive to own and operate, even though it costs more in the beginning to purchase.
This is a very simple example of how lifecycle cost analysis can be applied. There are many other variables you might want to consider, depending upon specific circumstances.
Performing a Fleet Defect Analysis
You purchase a fleet of new buses and, during the warranty period, you experience problems with a certain component on more than 10% of your buses. This is often an indication of a design flaw or other defect in the component and is likely to cost you money in extra repairs, maintenance and downtime.
You should establish a fleet defect clause in your bid documents. Having such a clause will give you the right to declare a troublesome component “unacceptable” and to require a supplier to either replace that component across the board or work out some agreement for an extended warranty.
Sometimes lifecycle cost analysis and fleet defect clauses are combined to encourage bus manufacturers and component suppliers to focus on “value engineering,” which puts less emphasis on cheapest selling price.
These two techniques may be adapted to any large-scale purchase of equipment. The key is purchasing for cost-effectiveness versus the cheapest price.
Lifecycle Costs Over 10 Years
Analysis Example....................................Bus A...........Bus B...........Bus C
Initial Purchase Price................................$35,000.........$37,000........$40,000
Cost of Funds Invested
(Assume 10 percent per year for 10 years)....$35,000........$37,000.........$40,000
Fuel costs @ $3/gallon
A. 150,000 miles / 10 mpg = 15,000 gallons....$45,000
B. 150,000 miles / 15 mpg = 10,000 gallons......................$30,000
C. 150,000 miles / 20 mpg = 7,500 gallons...........................................$22,500
Projected maintenance costs over 10 years....$30,000........$20,000........$10,000
Total Costs Over 10 Years......................$145,000......$124,000.....$112,500
Subscribe to Our Newsletter
More Maintenance
Cummins on Smarter, Simpler Engine Innovation
Cummins discusses its first-ever gasoline engine for school buses, EPA 2027, and why bus fleets still want durable, simpler internal combustion options.
Read More →
Report: 72% of Diesel School Buses Now Use Advanced Low-Emission Engines
New data shows advanced low-emission diesel technology continues expanding across school bus fleets, even as electric bus adoption gains momentum.
Read More →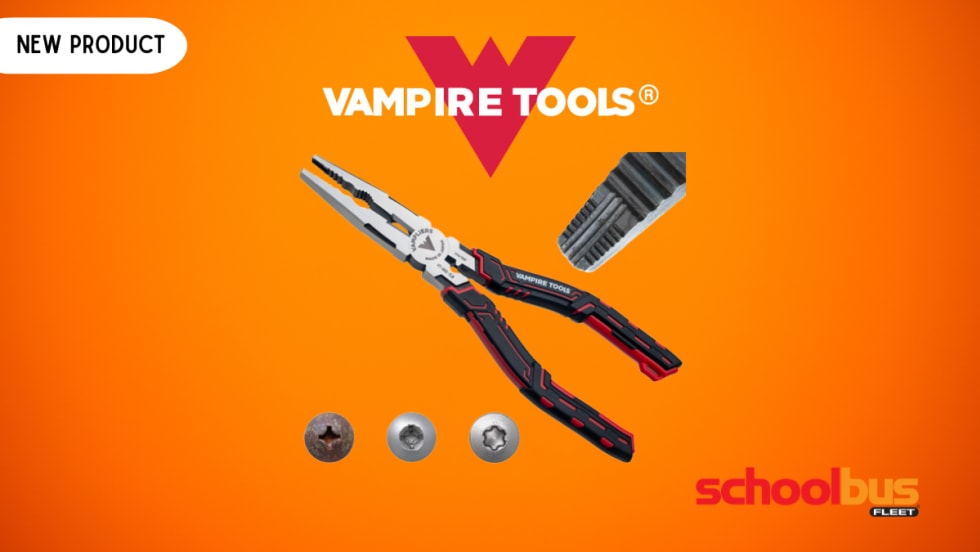
Vampire Tools' CAIMAN 7.5-Inch Multi-Purpose Screw Extractor Long-Nose Pliers with Crimper
Vampire Tools introduced the VAMPLIERS Caiman 7.5-inch multi-purpose pliers, combining screw extraction, cutting, crimping, and gripping functions into a single tool designed for fleet maintenance professionals.
Read More →
How Advanced Diagnostics Helps Bus Fleets Stay Ahead of Repairs
Chat with Noregon’s Kevin Smallhorn at ACT Expo about bus diagnostic tools, telematics integration, CNG maintenance support, and strategies to help reduce downtime and improve uptime.
Read More →
How School Bus Fleets are Getting Ahead of Breakdowns
Don’t let bus downtime wear you down. Here’s how bus operators are shifting from manual processes to AI-powered, data-driven maintenance systems for improved reliability and safety.
Read More →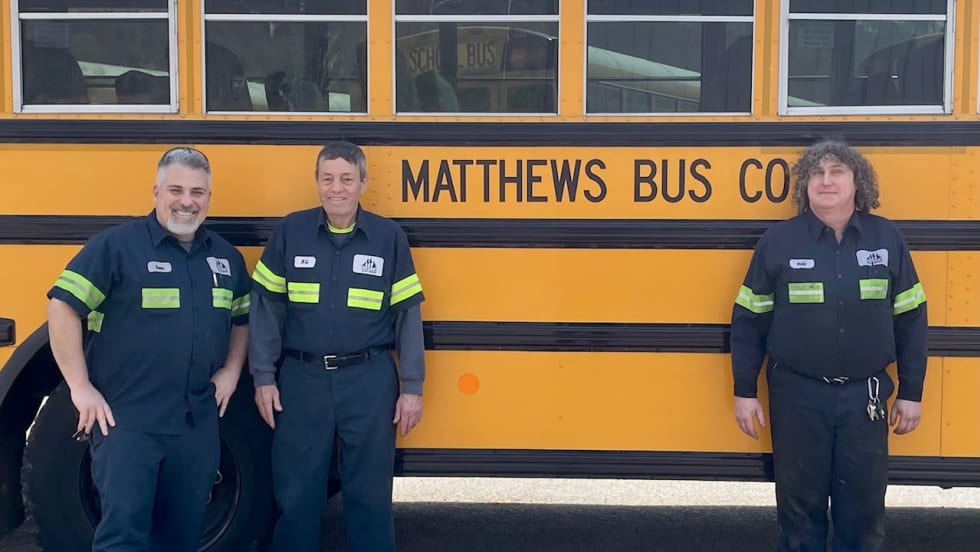
Pennsylvania School Bus Maintenance Team Praised for Dedication to Safety
Matthews Bus Company’s West Jefferson received a letter of commendation from the Pennsylvania State Police for their fleet inspections.
Read More →
Sponsored•April 20, 2026
2026 State of Student Transportation Report
Student transportation teams are being asked to do more with less, facing driver shortages, rising costs, and increasing safety expectations. This report uncovers how fleets are adapting, where technology is making the biggest impact, and why student ridership tracking is emerging as a top priority. Download the report to explore the key trends shaping 2026 and what they mean for your operation.
Read More →
Sponsored•April 16, 2026
From Chaos to Clarity: How School Districts Are Running Leaner Transportation Operations
Covering 38 routes on a Friday afternoon. Buses idling while routes overlap. Parents calling nonstop about late arrivals. Sound familiar? This whitepaper explores how district transportation leaders solved these exact problems — and what measurable results followed.
Read More →
Sponsored•April 1, 2026
The New Playbook for Safer, Smarter School Bus Maintenance
As school districts juggle aging buses, technician shortages and rising safety expectations, proactive fleet maintenance is becoming essential. This guide explores how telematics, predictive maintenance and real-time vehicle data can help transportation departments reduce breakdowns, extend vehicle life, improve compliance and keep students safer on the road.
Read More →
Sponsored•March 13, 2026
2026 School Bus Fleet Vendor Directory & Buyer's Guide
Searching for the right equipment, technology, or services for your school transportation program? This industry guide brings together manufacturers and suppliers across the entire school bus market, all in one place. Download it to find the partners who can help move your operation forward.
Read More →